

Olsen: 70
Everglades National Park (ENP)
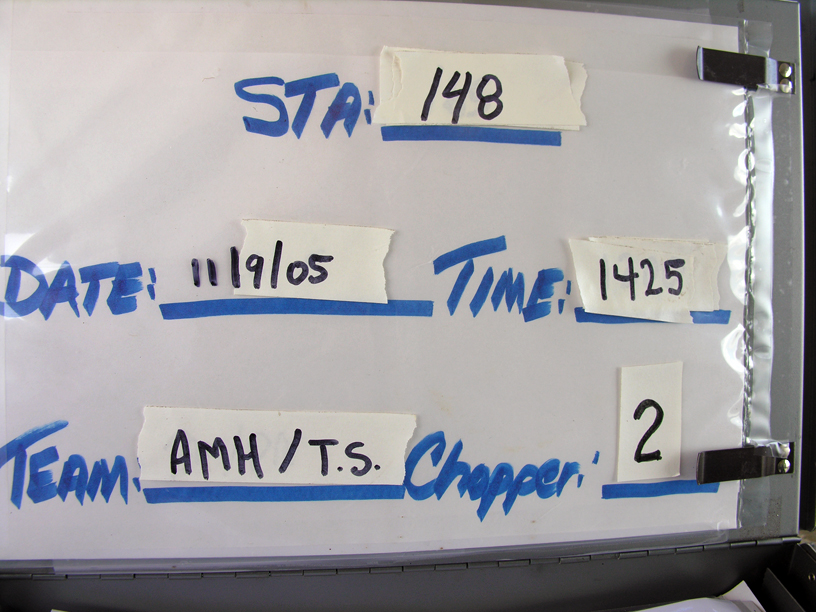
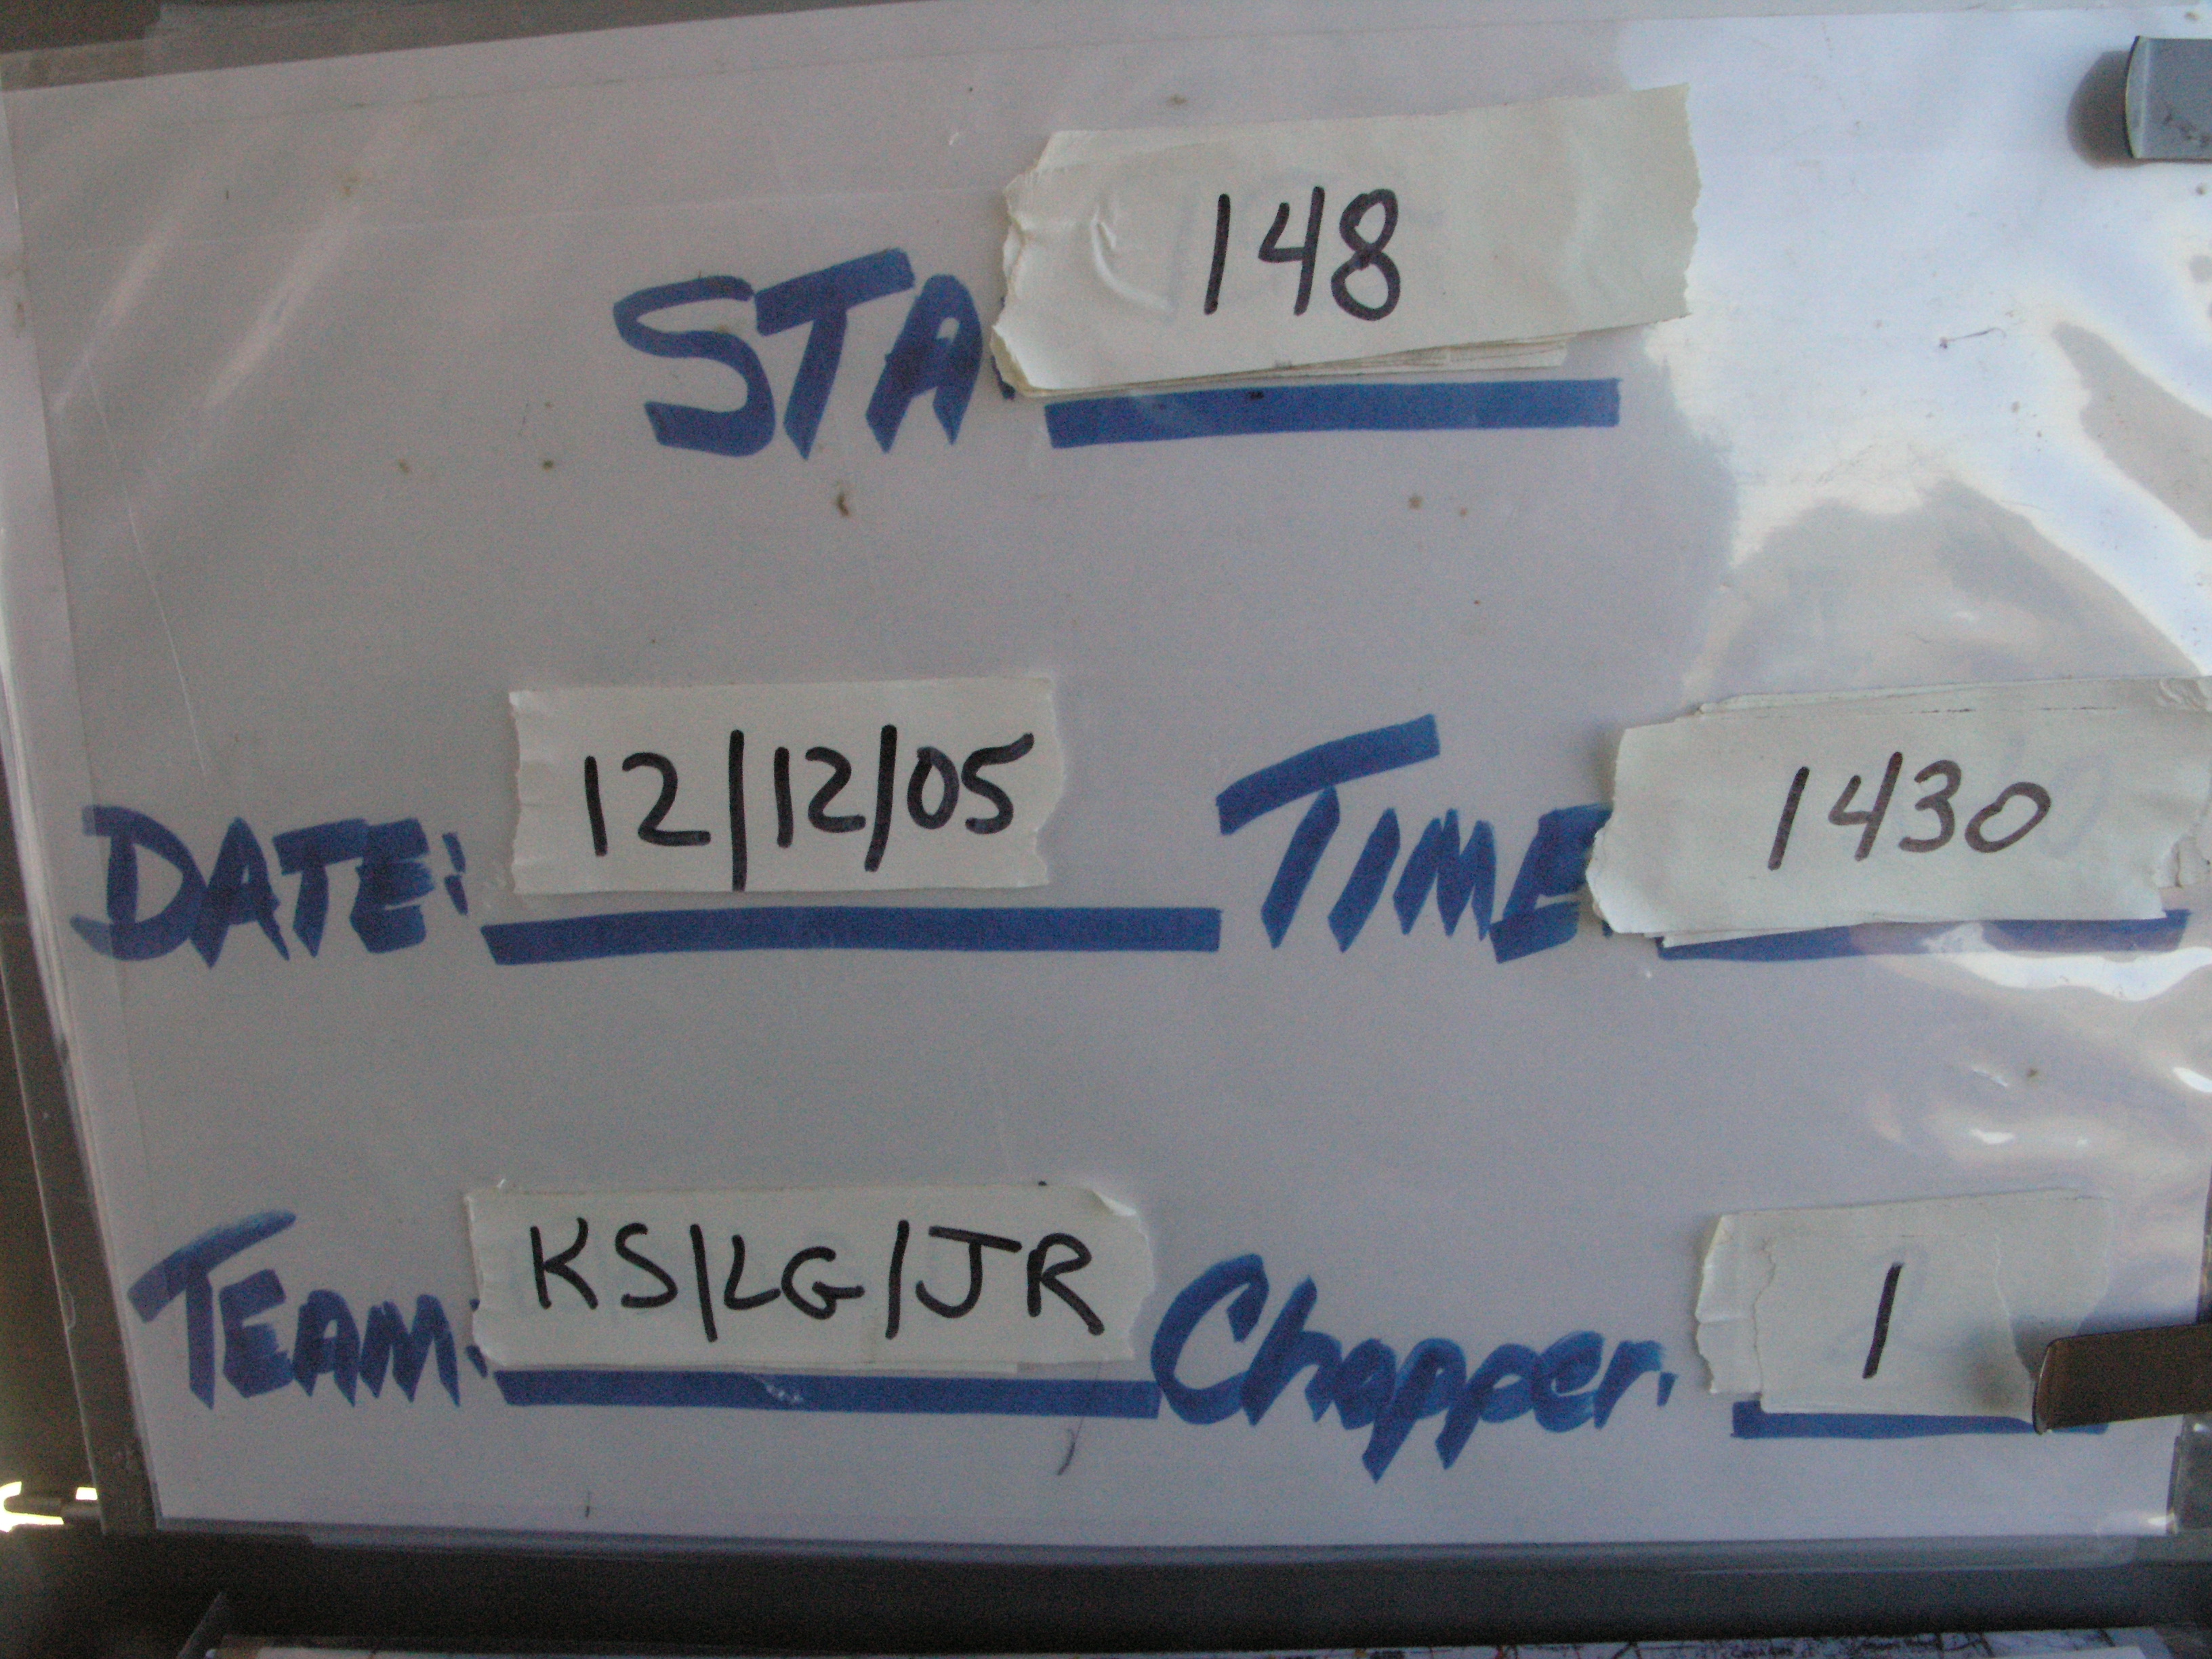
FIU Station: 148
| Panel: Regular | Season: Fall |
| BioChem Date/Time: 2005-11-09 14:25:00 | |
| BioChem Crew: Anne-Marie Hoffman/Tim Simpson | |
| Plants Date: 2005-12-12 | Aquatic Date: 2005-11-30 |
| Location | NAD83 | NAD27 | |
|---|---|---|---|
| Latitude | 25.56223305 | 25.562231 | |
| Longitude | -80.780358 | -80.78034 | |
| UTM Y (northing) | 2827020 | 2827223 | |
| UTM X (easting) | 522043 | 522064 |
Comments: GPS FILE 148A
Basic
| Item | Value | Description |
|---|---|---|
| Camera | 2 | Digital camera used for field documentation of habitat and soil core |
| CHLAVOL | 140 | volume of surface water filtered for chlorophyll a analysis |
| Chopper | 2 | number of helicopter and associated sampling equipment and supply cache |
| COND | 462 | in situ surface water conductivity, YSI sonde |
| Cycle | 7 | sampling cycle number |
| DO | 8.46 | in situ surface water DO, YSI sonde |
| FISHNO1 | 15 | number of mosquitofish collected for Hg analysis |
| FLOCCOLperc | 100 | Percent of floc collected from core |
| FLOCCONT | 1 storemore | number and kind of container used for floc |
| Flow | sheetflow | description of surface water flow at sampling site |
| PERIDOM | epiphytic | dominant periphyton type |
| PERIPB | no | benthic periphyton collected |
| PERIPE | yes | epiphytic periphyton collected |
| PERIPF | no | floating mat periphyton collected |
| pH | 7.71 | in situ surface water pH, YSI sonde |
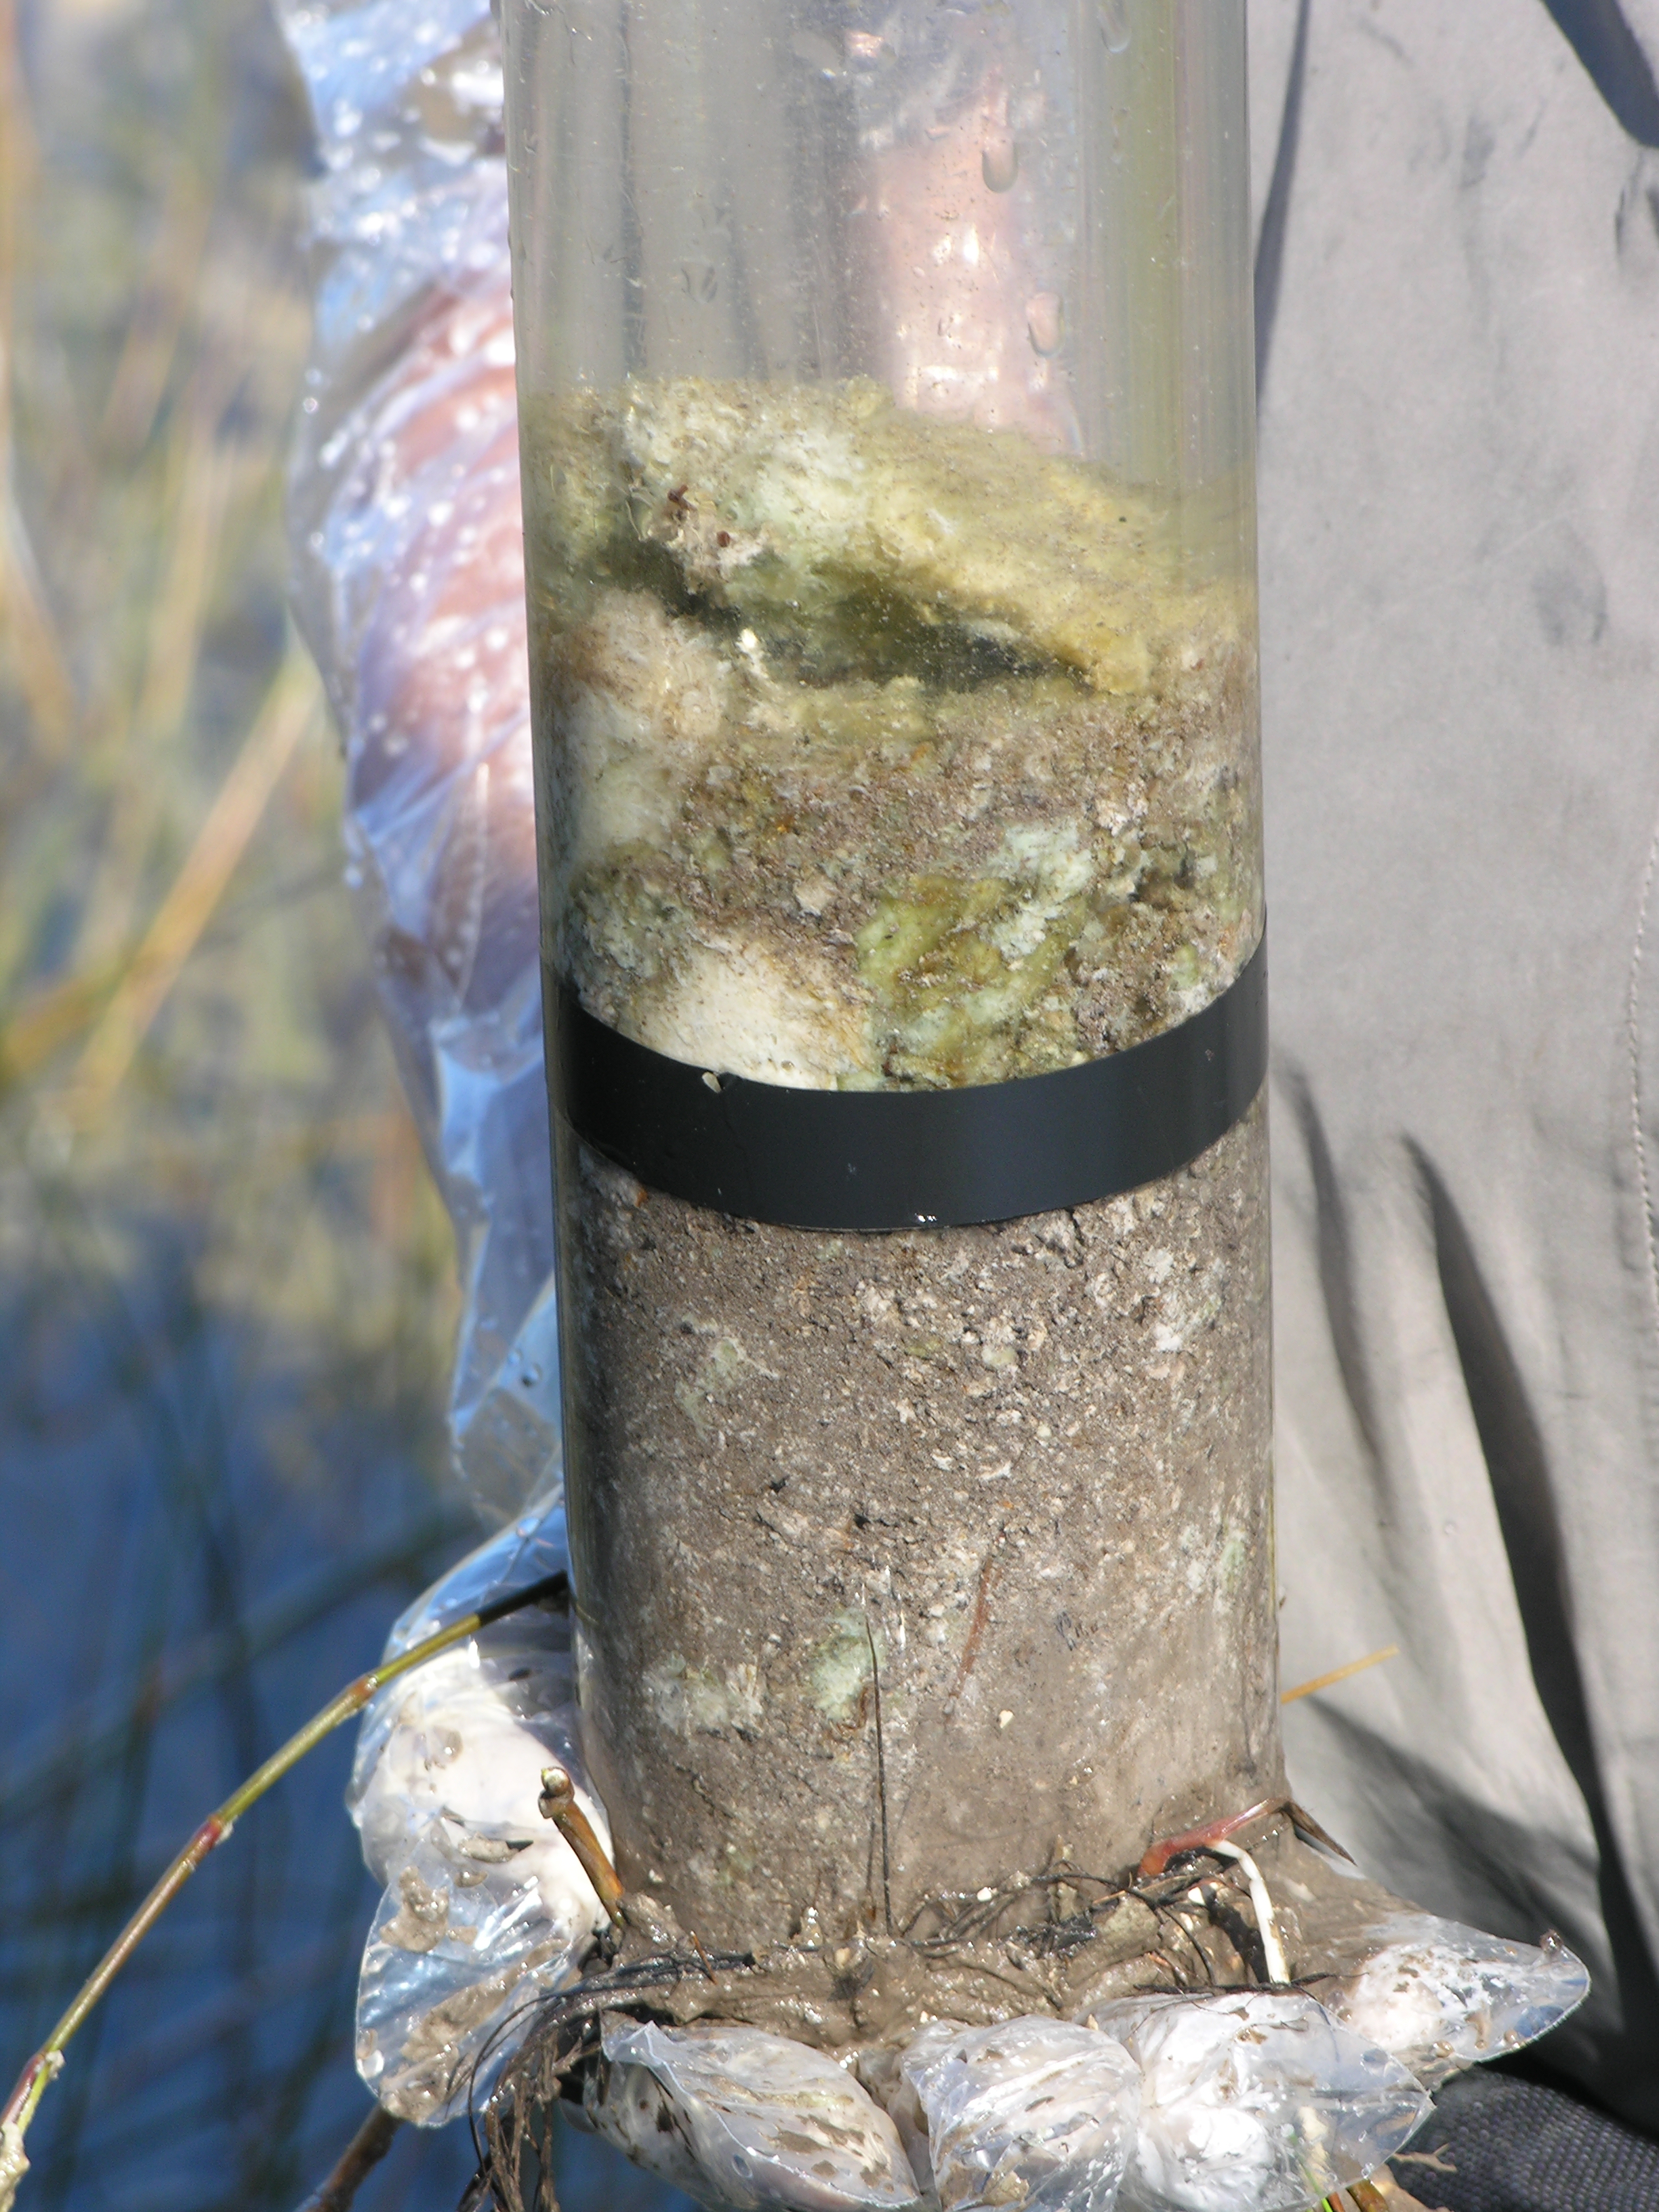
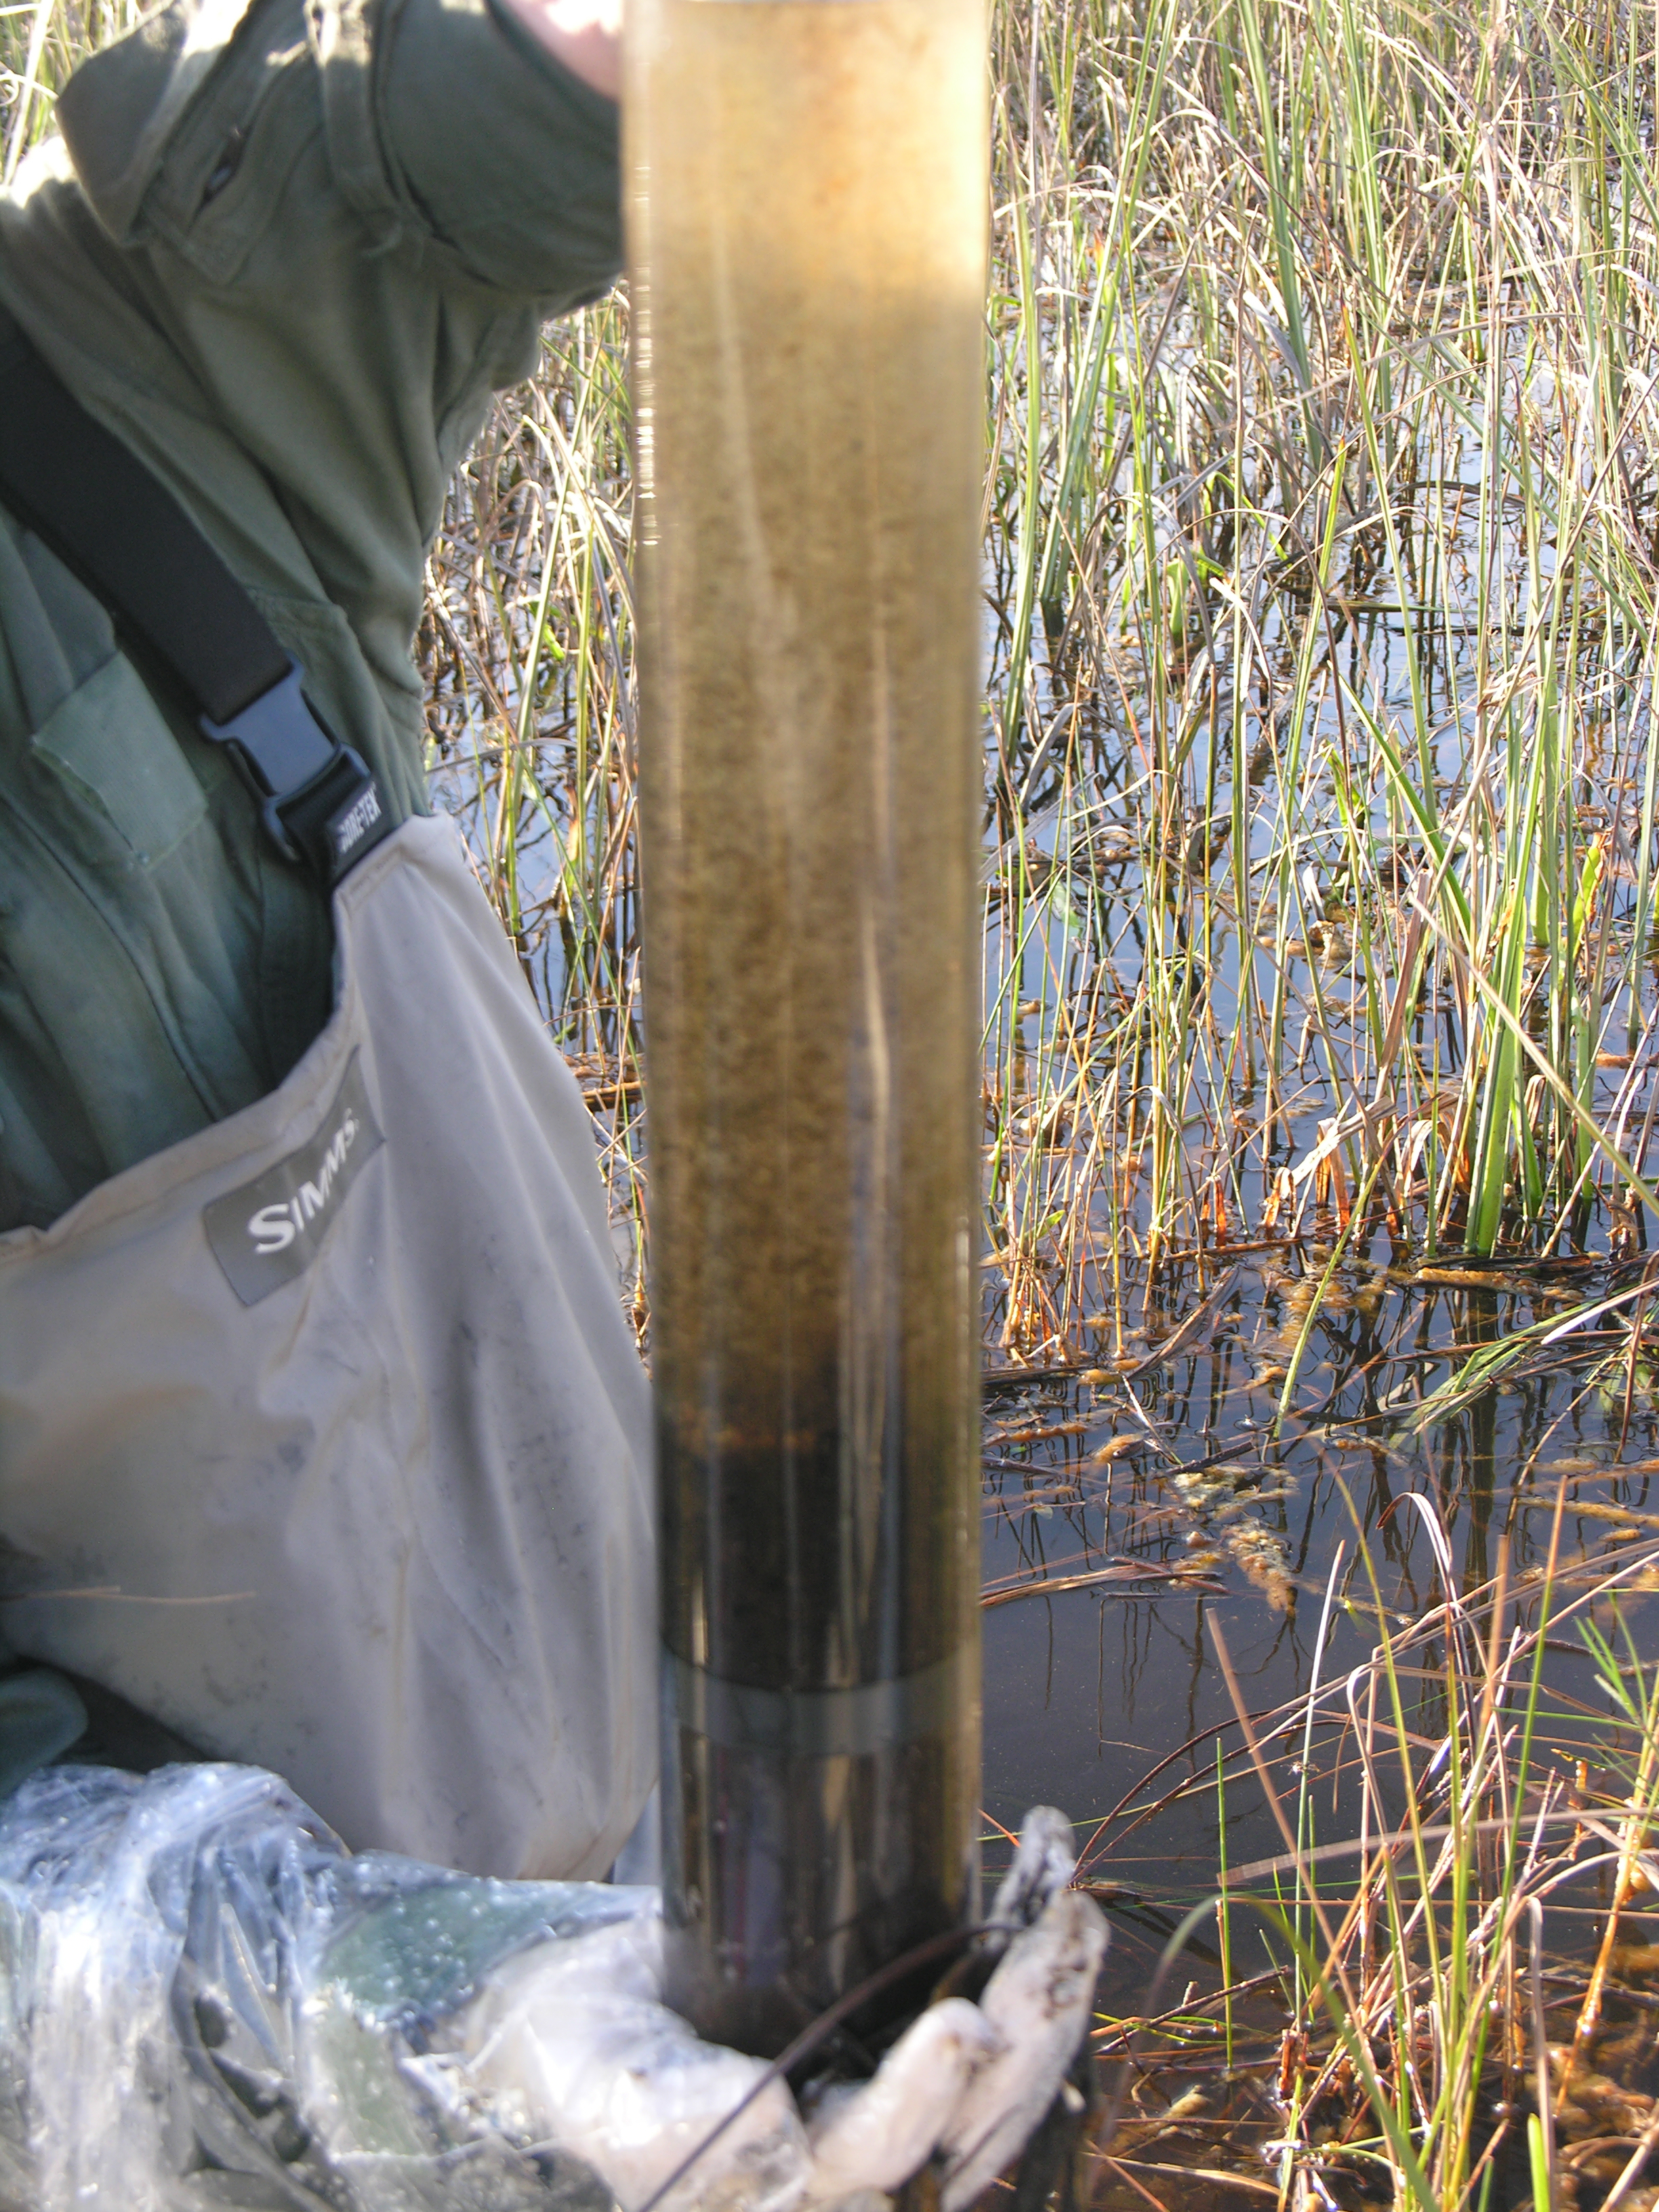
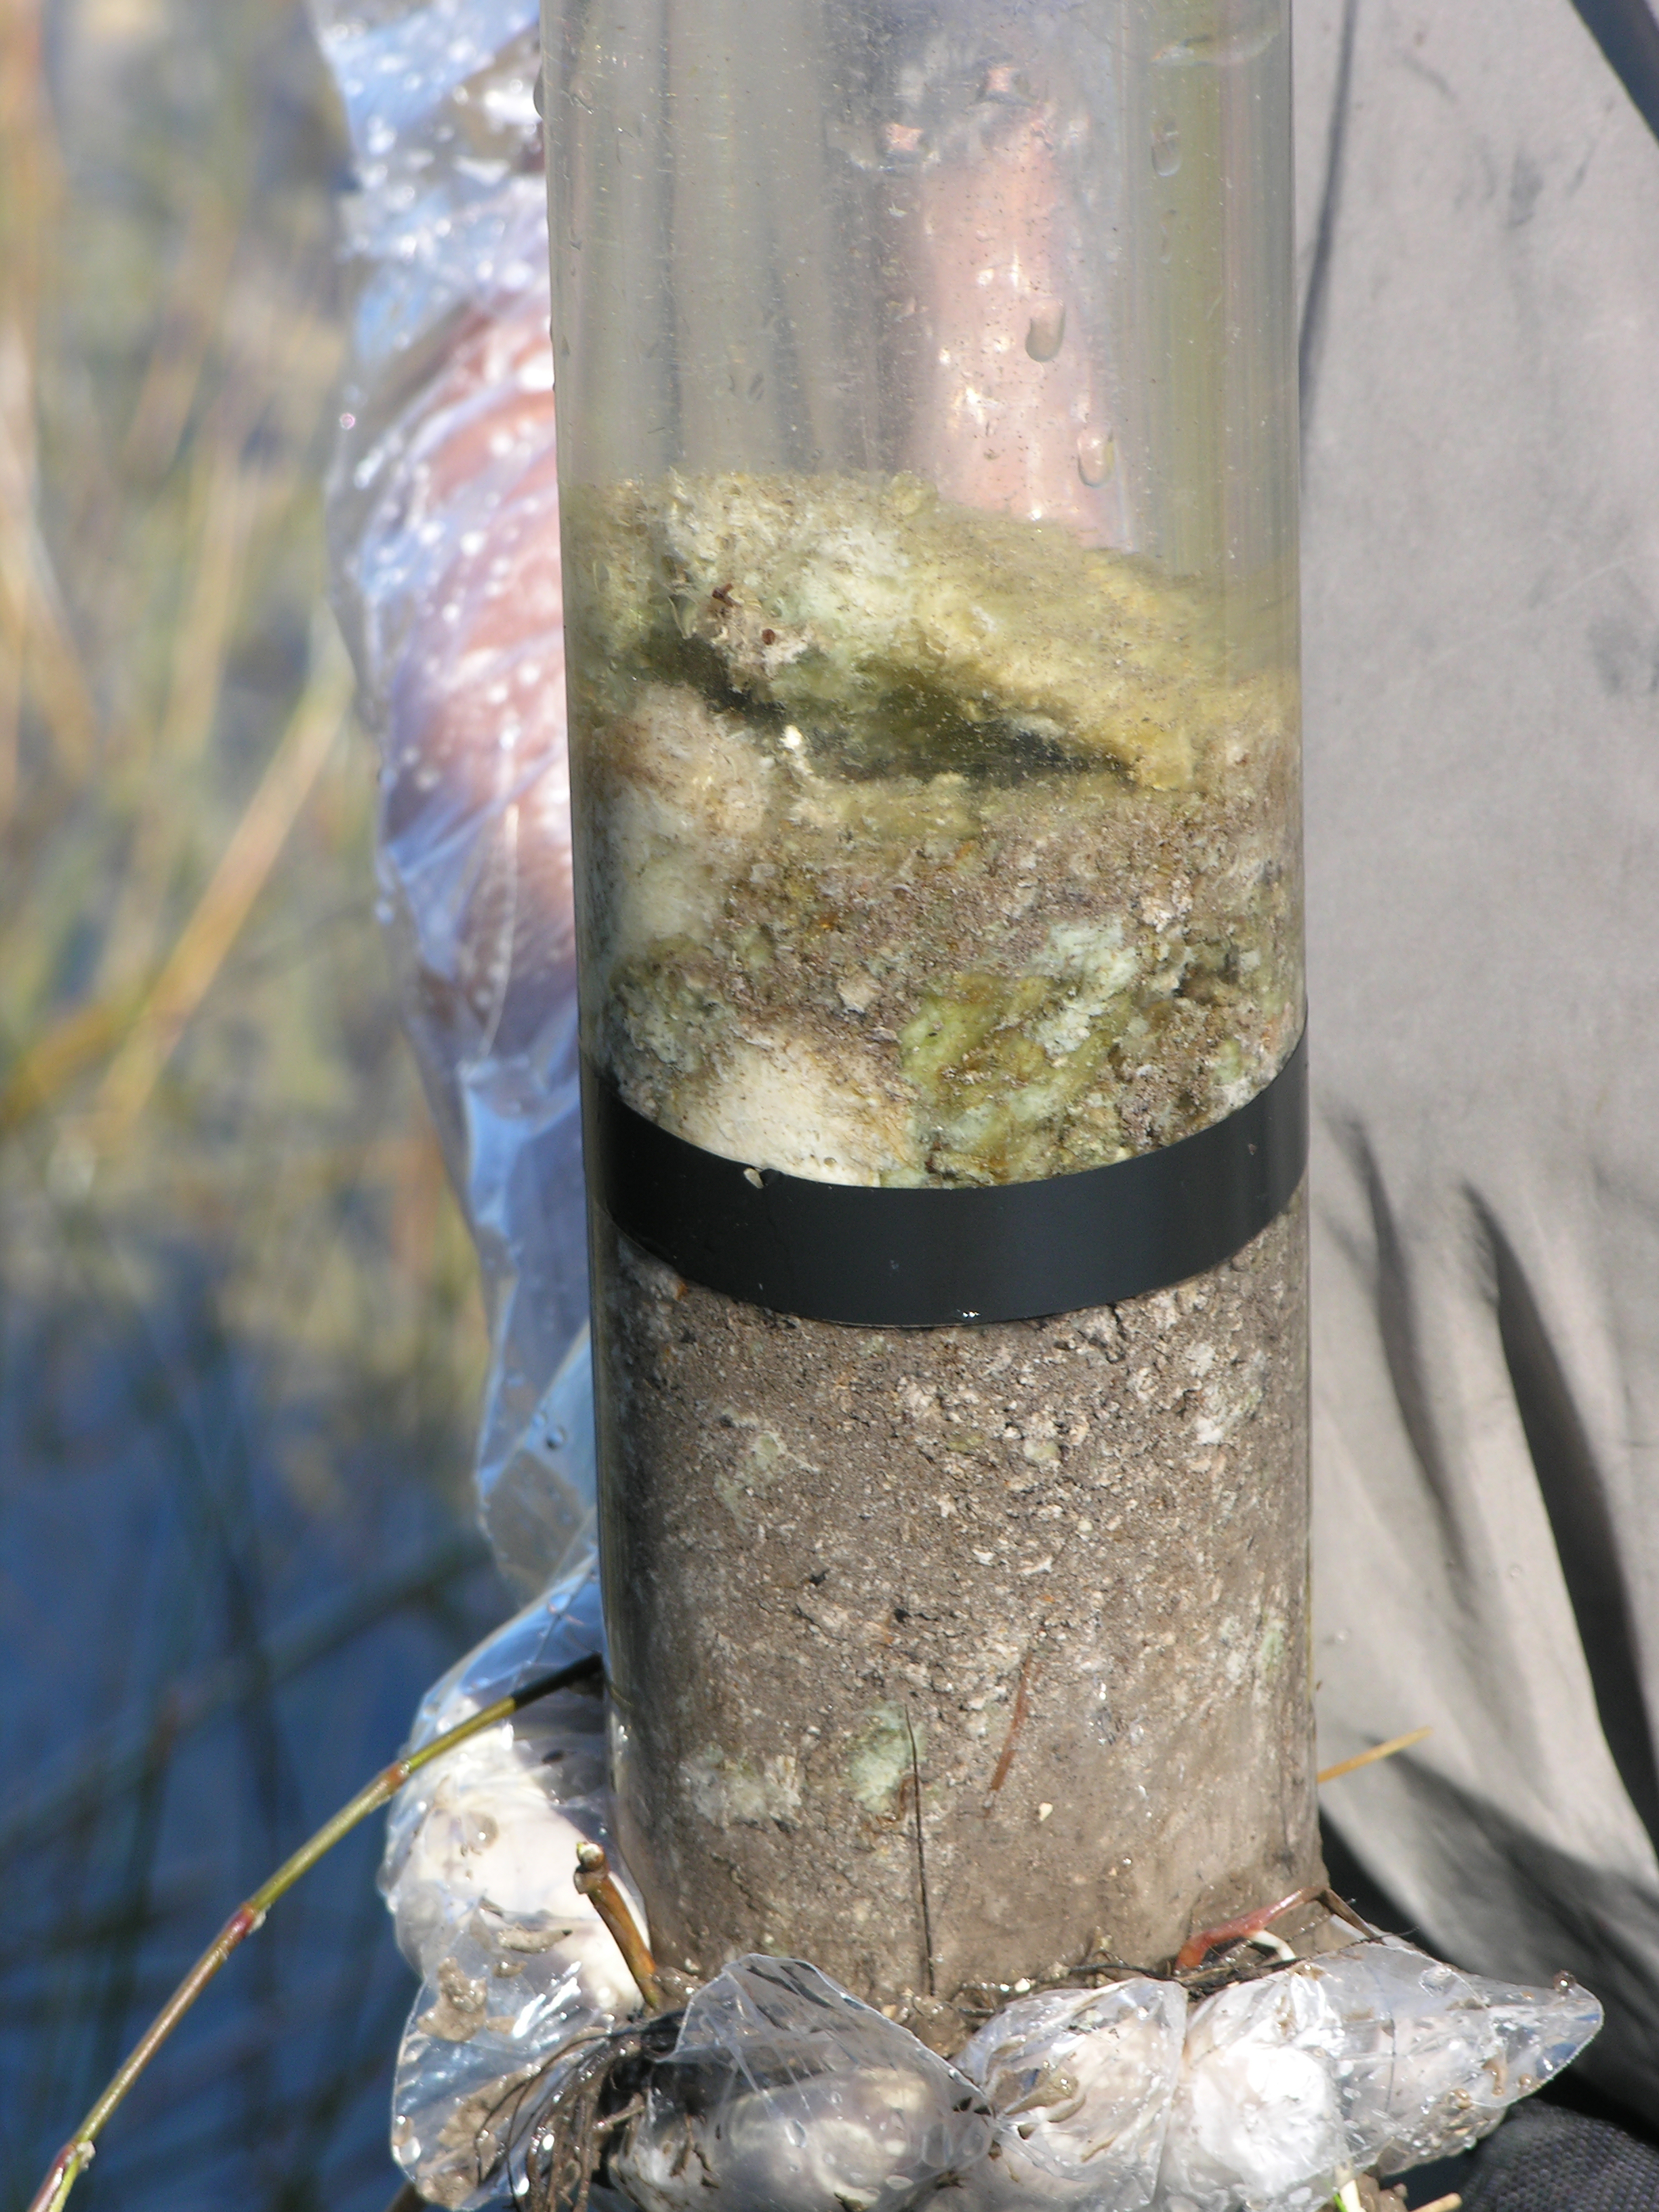
| Soiltype | peat | soil type categories, by visual observation |
| Station | 148 | sampling station numbers, unique for 2005, assigned by EPA to the Olsen site numbers; many of the FIU researchers use these numbers as their sample identifiers |
| Temp | 27.88 | in situ surface water temperature, YSI sonde |
| Turb | 0.9 | in situ surface water turbidity, YSI sonde |
| VEGTYPE | sawgrass marsh | plant community observed at sampling site |
| Weather | 1 clear | weather conditions |
| X | NOMINAL | nominal = sampled within 5 meters of GPS coordinates shifted = 5-20 meters station rejected = >20 meters |
| YSIDEPTH | 6 | depth of deployment of probe array in surface water |
| PlantDate | 2005-12-12 | Plant collection date |
| Item | Value 1 | Value 2 | Value 3 | Average | Units | Description |
|---|---|---|---|---|---|---|
| DEPBEDR | 5 | 3.55 | 3.15 | 3.90 | feet | depth to bedrock, point of refusal with metal probe |
| FLOCTH | 7 | 4 | 4 | 5 | cm | vertical extent (length) of floc layer in core |
| PWEAgCl | -51.5 | -50.2 | -62.1 | -54.60 | mV | pore water, field-measured, in-line Ag/AgCl reference microprobe |
| PWEh | 147.5 | 148.8 | 136.9 | 144.4 | mV | pore water, field-measured, in-line Ag/AgCl reference microprobe corrected to standard Hydrogen electrode by adding 199 mV |
| SoilCTH | 10 | 10 | 10 | 10 | cm | vertical extent (length) of soil sample, from soil surface to bottom of core |
| SoilTHI | 3.4 | 1.85 | 1.35 | 2.2 | feet | soil thickness, metal probe to point of refusal |
| WatDept | 1.6 | 1.7 | 1.8 | 1.7 | feet | water depth |
BioChemistry
| Item | Value | Units | Q | Protocol | Description |
|---|---|---|---|---|---|
| AFDWFCFS | 0.81 | g/g | FIU SERC | Ash Free Dry Weight of floc | |
| AFDWSDFS | 91.21 | % | FIU SERC | Ash Free Dry Weight for soil | |
| APASWEE | 1.6 | µmole/L*hr | EPA ESAT | Alkaline Phosphatase Activity in surface water | |
| BDFCFS | 0.016 | g/cc | FIU SERC | Bulk Density of floc | |
| BDSDFS | 0.1 | g/cc | FIU SERC | Bulk Density for soil | |
| BRPWEA | 0.12 | mg/L | EPA SESD | Bromide in pore water | |
| BRSWEA | 0.1 | mg/L | U | EPA SESD | Bromide in surface water |
| CHLAFCFS | 10.255 | µg/g | FIU SERC | chlorophyll a in floc, dry weight | |
| CHLASWFB | 1.9 | µg/L | FIU SERC | Chlorophyll a in surface water | |
| CLPWEA | 49 | mg/L | EPA SESD | Chloride in pore water | |
| CLSWEA | 54 | mg/L | EPA SESD | Chloride in surface water | |
| DOCSWD | 15 | mg/L | FDEP | Dissolved Organic Carbon in surface water | |
| FDOCPWD | 20 | mg/L | A | FDEP | Dissolved Organic Carbon in porewater |
| FNH4RPWF | 1.4 | mg/L | FIU SERC | Filtered Ammonia in pore water, recalculated | |
| FNH4RSWF | 0.014 | mg/L | J | FIU SERC | Filtered Ammonia in surface water, recalculated |
| FNNRPWFB | 0.027 | mg/L | FIU SERC | Filtered Nitrite + Nitrate in pore water, recalculated | |
| FNNRSWFB | 0.017 | mg/L | FIU SERC | Filtered Nitrite + Nitrate in surface water, recalculated | |
| FNO2RPWF | 0.0075 | mg/L | FIU SERC | Filtered Nitrite in pore water, recalculated | |
| FNO2RSWF | 0.0004 | mg/L | J | FIU SERC | Filtered Nitrite in surface water, recalculated |
| FNO3RPWF | 0.02 | mg/L | FIU SERC | Filtered Nitrate in pore water, recalculated | |
| FNO3RSWF | 0.017 | mg/L | J | FIU SERC | Filtered Nitrate in surface water, recalculated |
| FPWEA | 0.19 | mg/L | J | EPA SESD | Fluoride in pore water |
| FSWEA | 0.15 | mg/L | J | EPA SESD | Fluoride in surface water |
| H2SPWEE | 0.11 | mg/L | EPA ESAT | Sulfide in pore water | |
| H2SSWEE | 0.02 | mg/L | U | EPA ESAT | Sulfide in surface water |
| MCFCFS | 0.19 | g/g | FIU SERC | Mineral Content of floc | |
| MCSDFS | 0.088 | g/g | FIU SERC | Mineral Content of soil | |
| MEHGFCFC | 6.3 | ng/g | FIU SERC | Methyl Mercury in floc | |
| MEHGPEFC | 3.4 | ng/g | FIU SERC | Methyl Mercury in epiphytic periphyton | |
| MEHGSDFC | 1.2 | ng/g | A | FIU SERC | Methyl Mercury in soil |
| MEHGSWB | 0.34 | ng/L | J | Battelle | Methyl Mercury in surface water |
| pHSDEE | 6.42 | EPA SESD | ex situ soil pH | ||
| SO4PWEA | 0.19 | mg/L | EPA SESD | Sulfate in pore water | |
| SO4SWEA | 3.1 | mg/L | EPA SESD | Sulfate in surface water | |
| SRPRPWFB | 0.017 | mg/L | FIU SERC | Soluble Reactive Phosphorus in pore water, recalculated | |
| SRPRSWFB | 6.5 | µg/L | U | FIU SERC | Soluble Reactive Phosphorus in surface water, recalculated |
| TCFCFB | 40 | % | FIU SERC | Total Carbon in floc | |
| TCSDFB | 46 | % | FIU SERC | Total Carbon in soil | |
| THGFCFC | 160 | ng/g | FIU SERC | Total Mercury in floc | |
| THGFSFC | 320 | µg/kg | FIU SERC | Total Mercury in mosquitofish (Gambusia affinis), average of 7 individuals | |
| THGFSSD | 26 | µg/kg | standard devaition of total mercury in individual mosquitofish for 7 individuals | ||
| THGPEFC | 26 | ng/g | J | FIU SERC | Total Mercury in epiphytic periphyton |
| THGSDFC | 260 | ng/g | FIU SERC | Total Mercury in soil | |
| THGSWD | 2.3 | ng/L | FDEP | Total Mercury in surface water | |
| TINAPWFB | 1.4 | mg/L | FIU SERC | Total Inorganic Nitrogen (calculated) in pore water, recalculated | |
| TINSWFB | 0.032 | mg/L | J | FIU SERC | Total Inorganic Nitrogen (calculated) in surface water, recalculated |
| TNFCFB | 3.3 | % | FIU SERC | Total Nitrogen in floc | |
| TNRSWFB | 0.36 | mg/L | FIU SERC | Total Nitrogen in surface water, recalculated | |
| TNSDFB | 3.5 | % | FIU SERC | Total Nitrogen in soil | |
| TONSWFB | 0.33 | mg/L | J | FIU SERC | Total Organic Nitrogen (calculated) in surface water, recalculated |
| TPRFCFB | 490 | µg/g | FIU SERC | Total Phosphorus in floc, recalculated | |
| TPRSDFB | 540 | µg/g | FIU SERC | Total Phosphorus in soil, recalculated | |
| TPRSWFB | 4.7 | µg/L | FIU SERC | Total Phosphorus in surface water, recalculated | |
| WCFCFS | 0.98 | g/g | FIU SERC | Water Content of floc | |
| WCSDFS | 0.91 | g/g | FIU SERC | Water Content of soil |
Plants
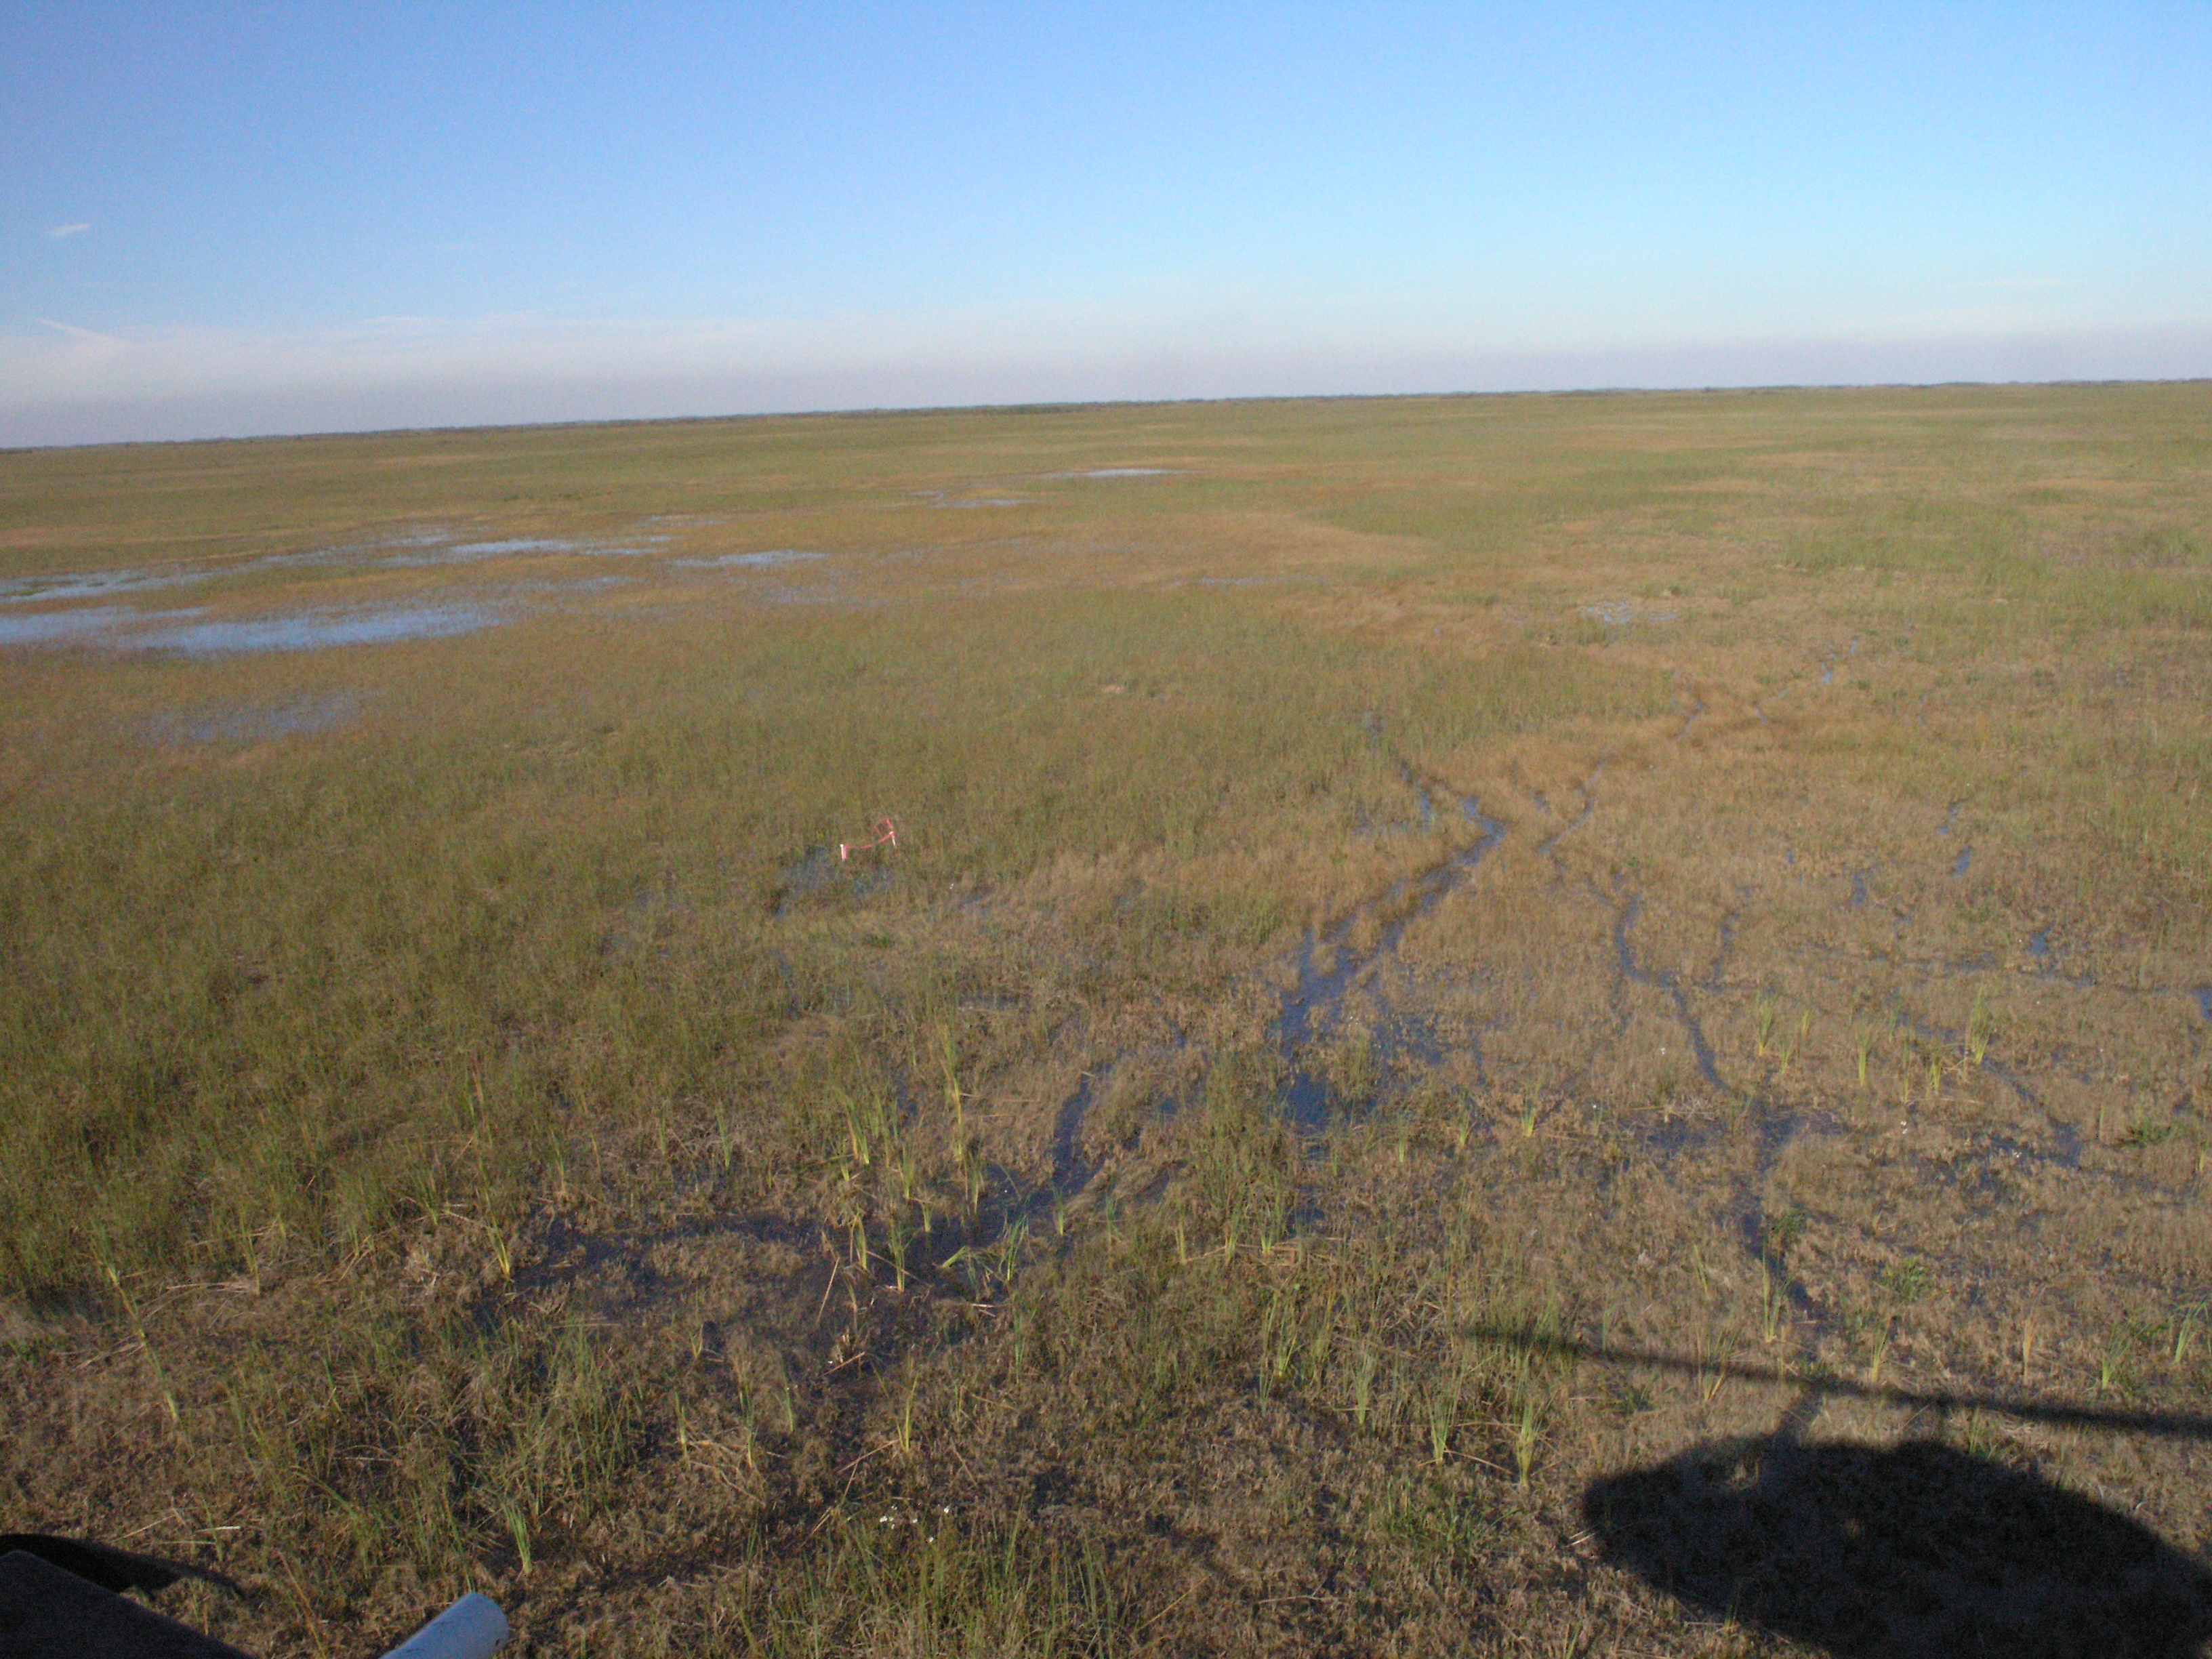
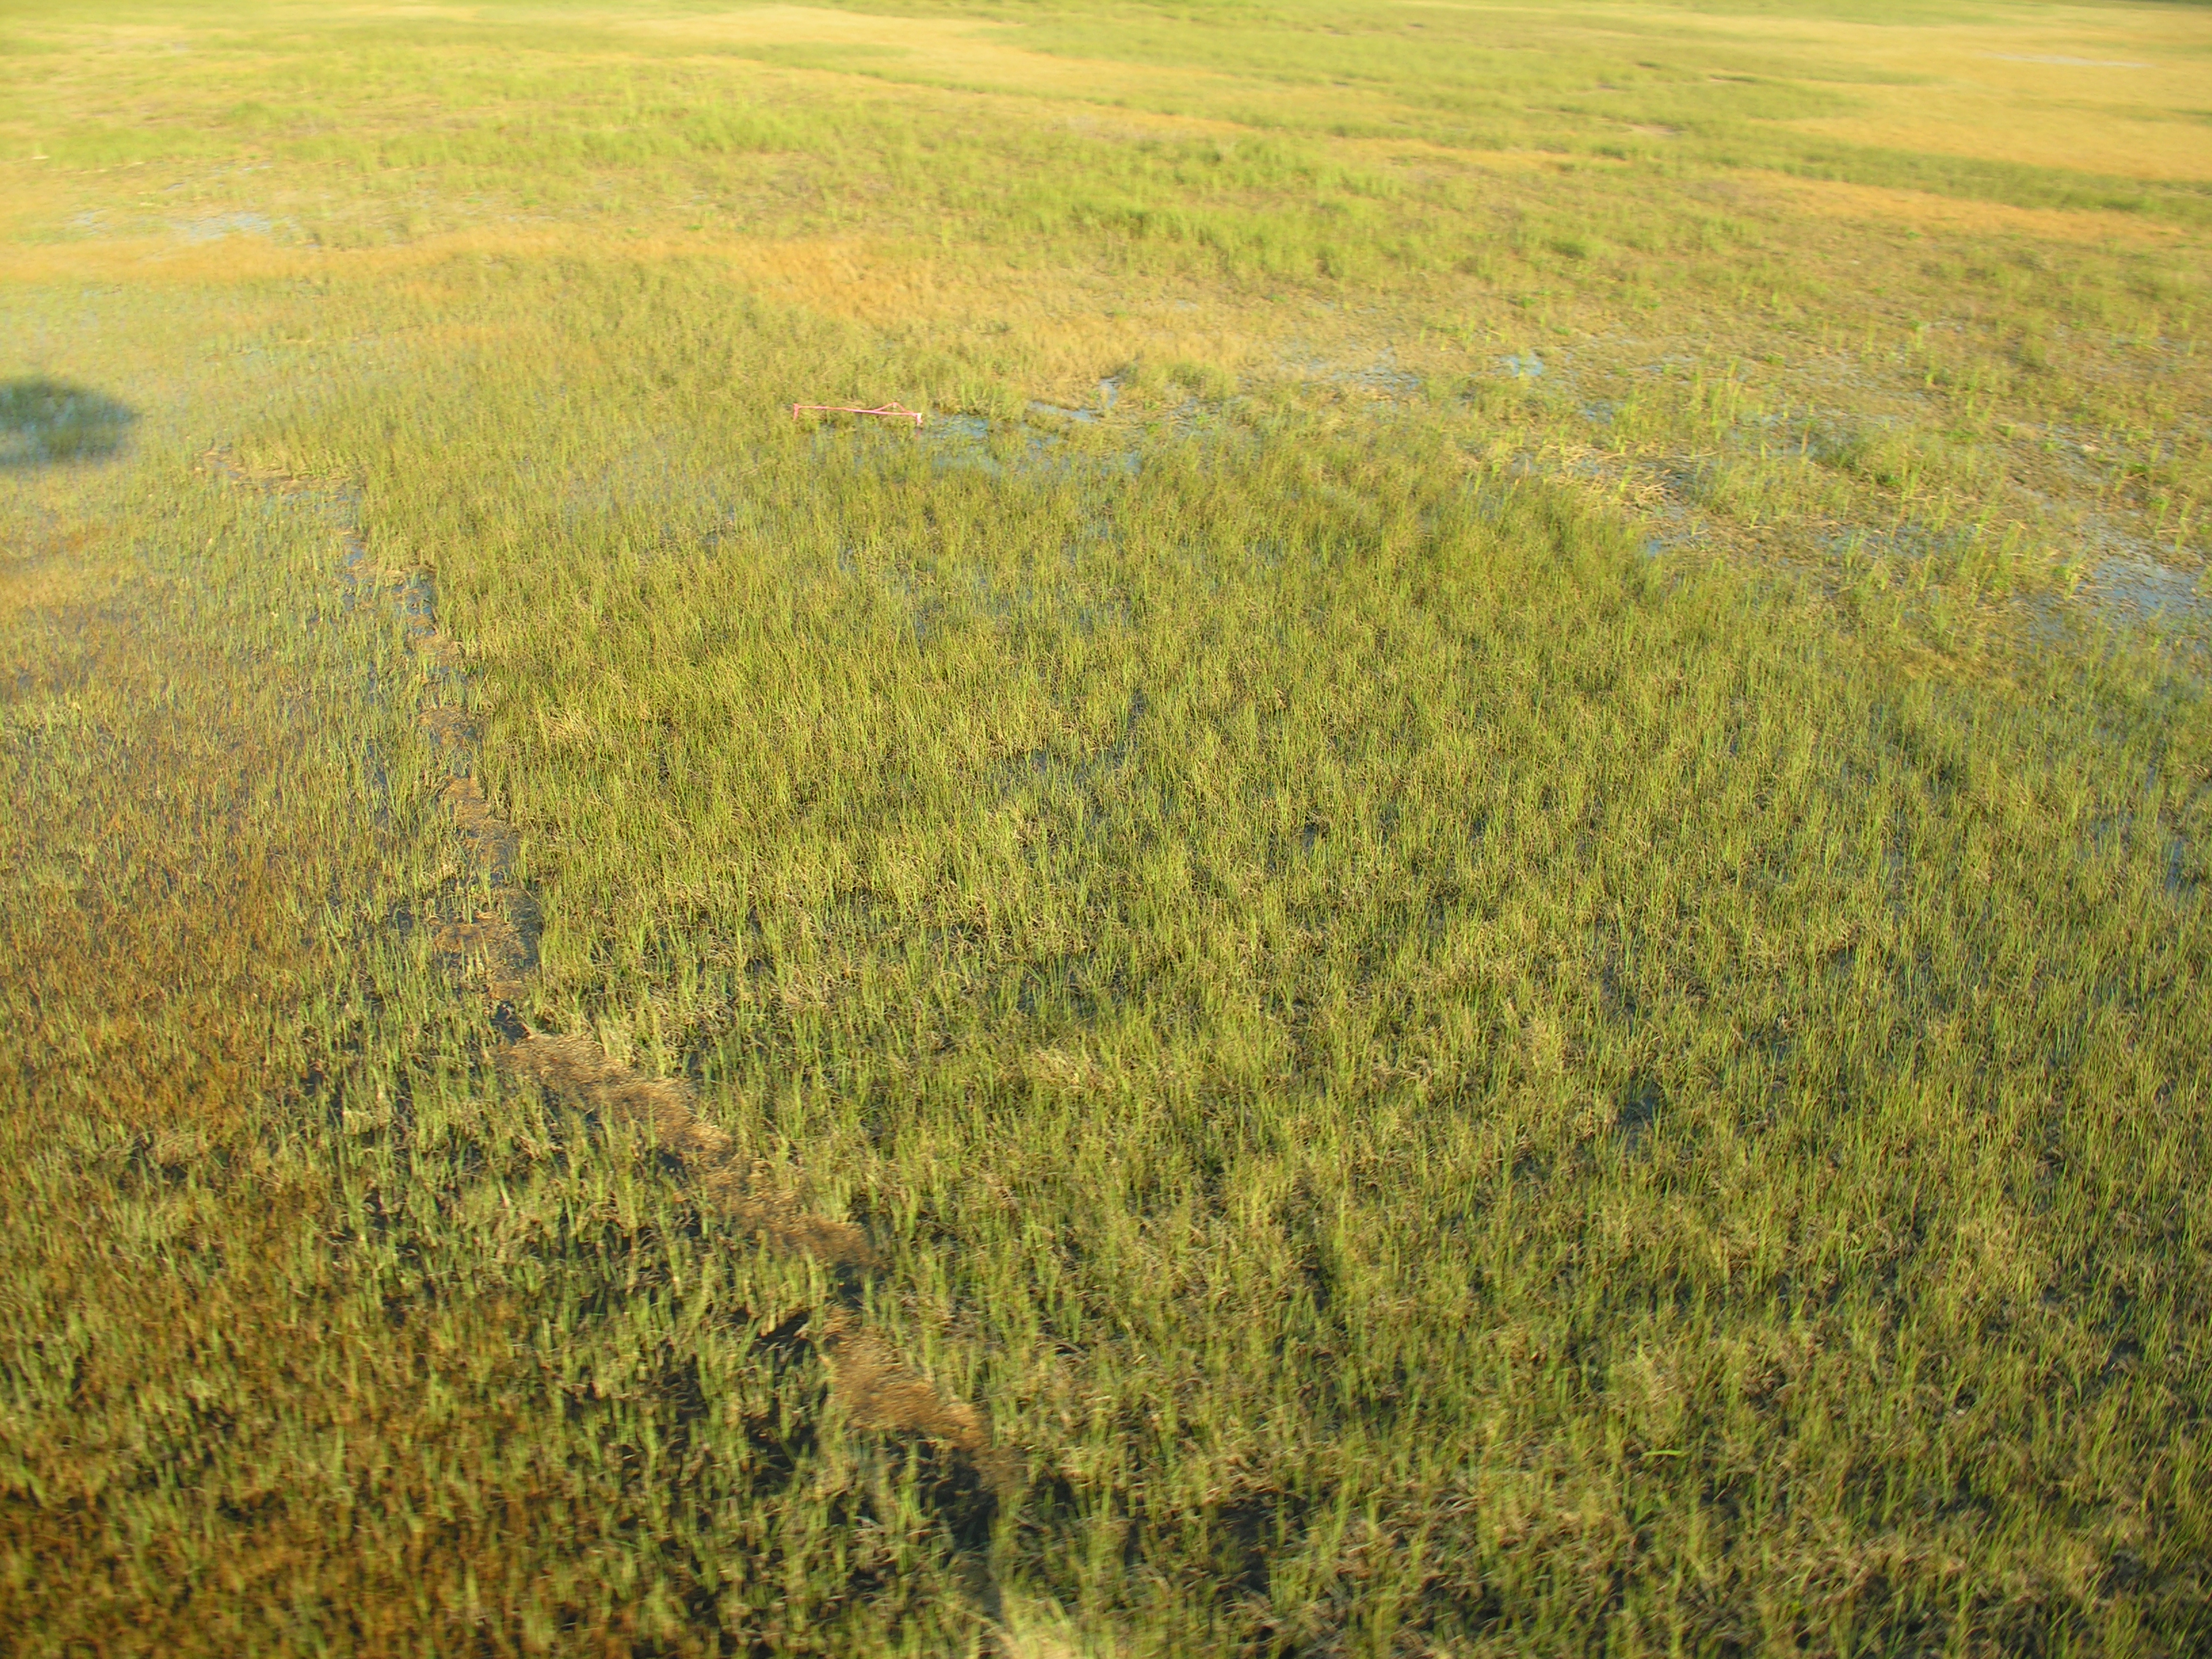
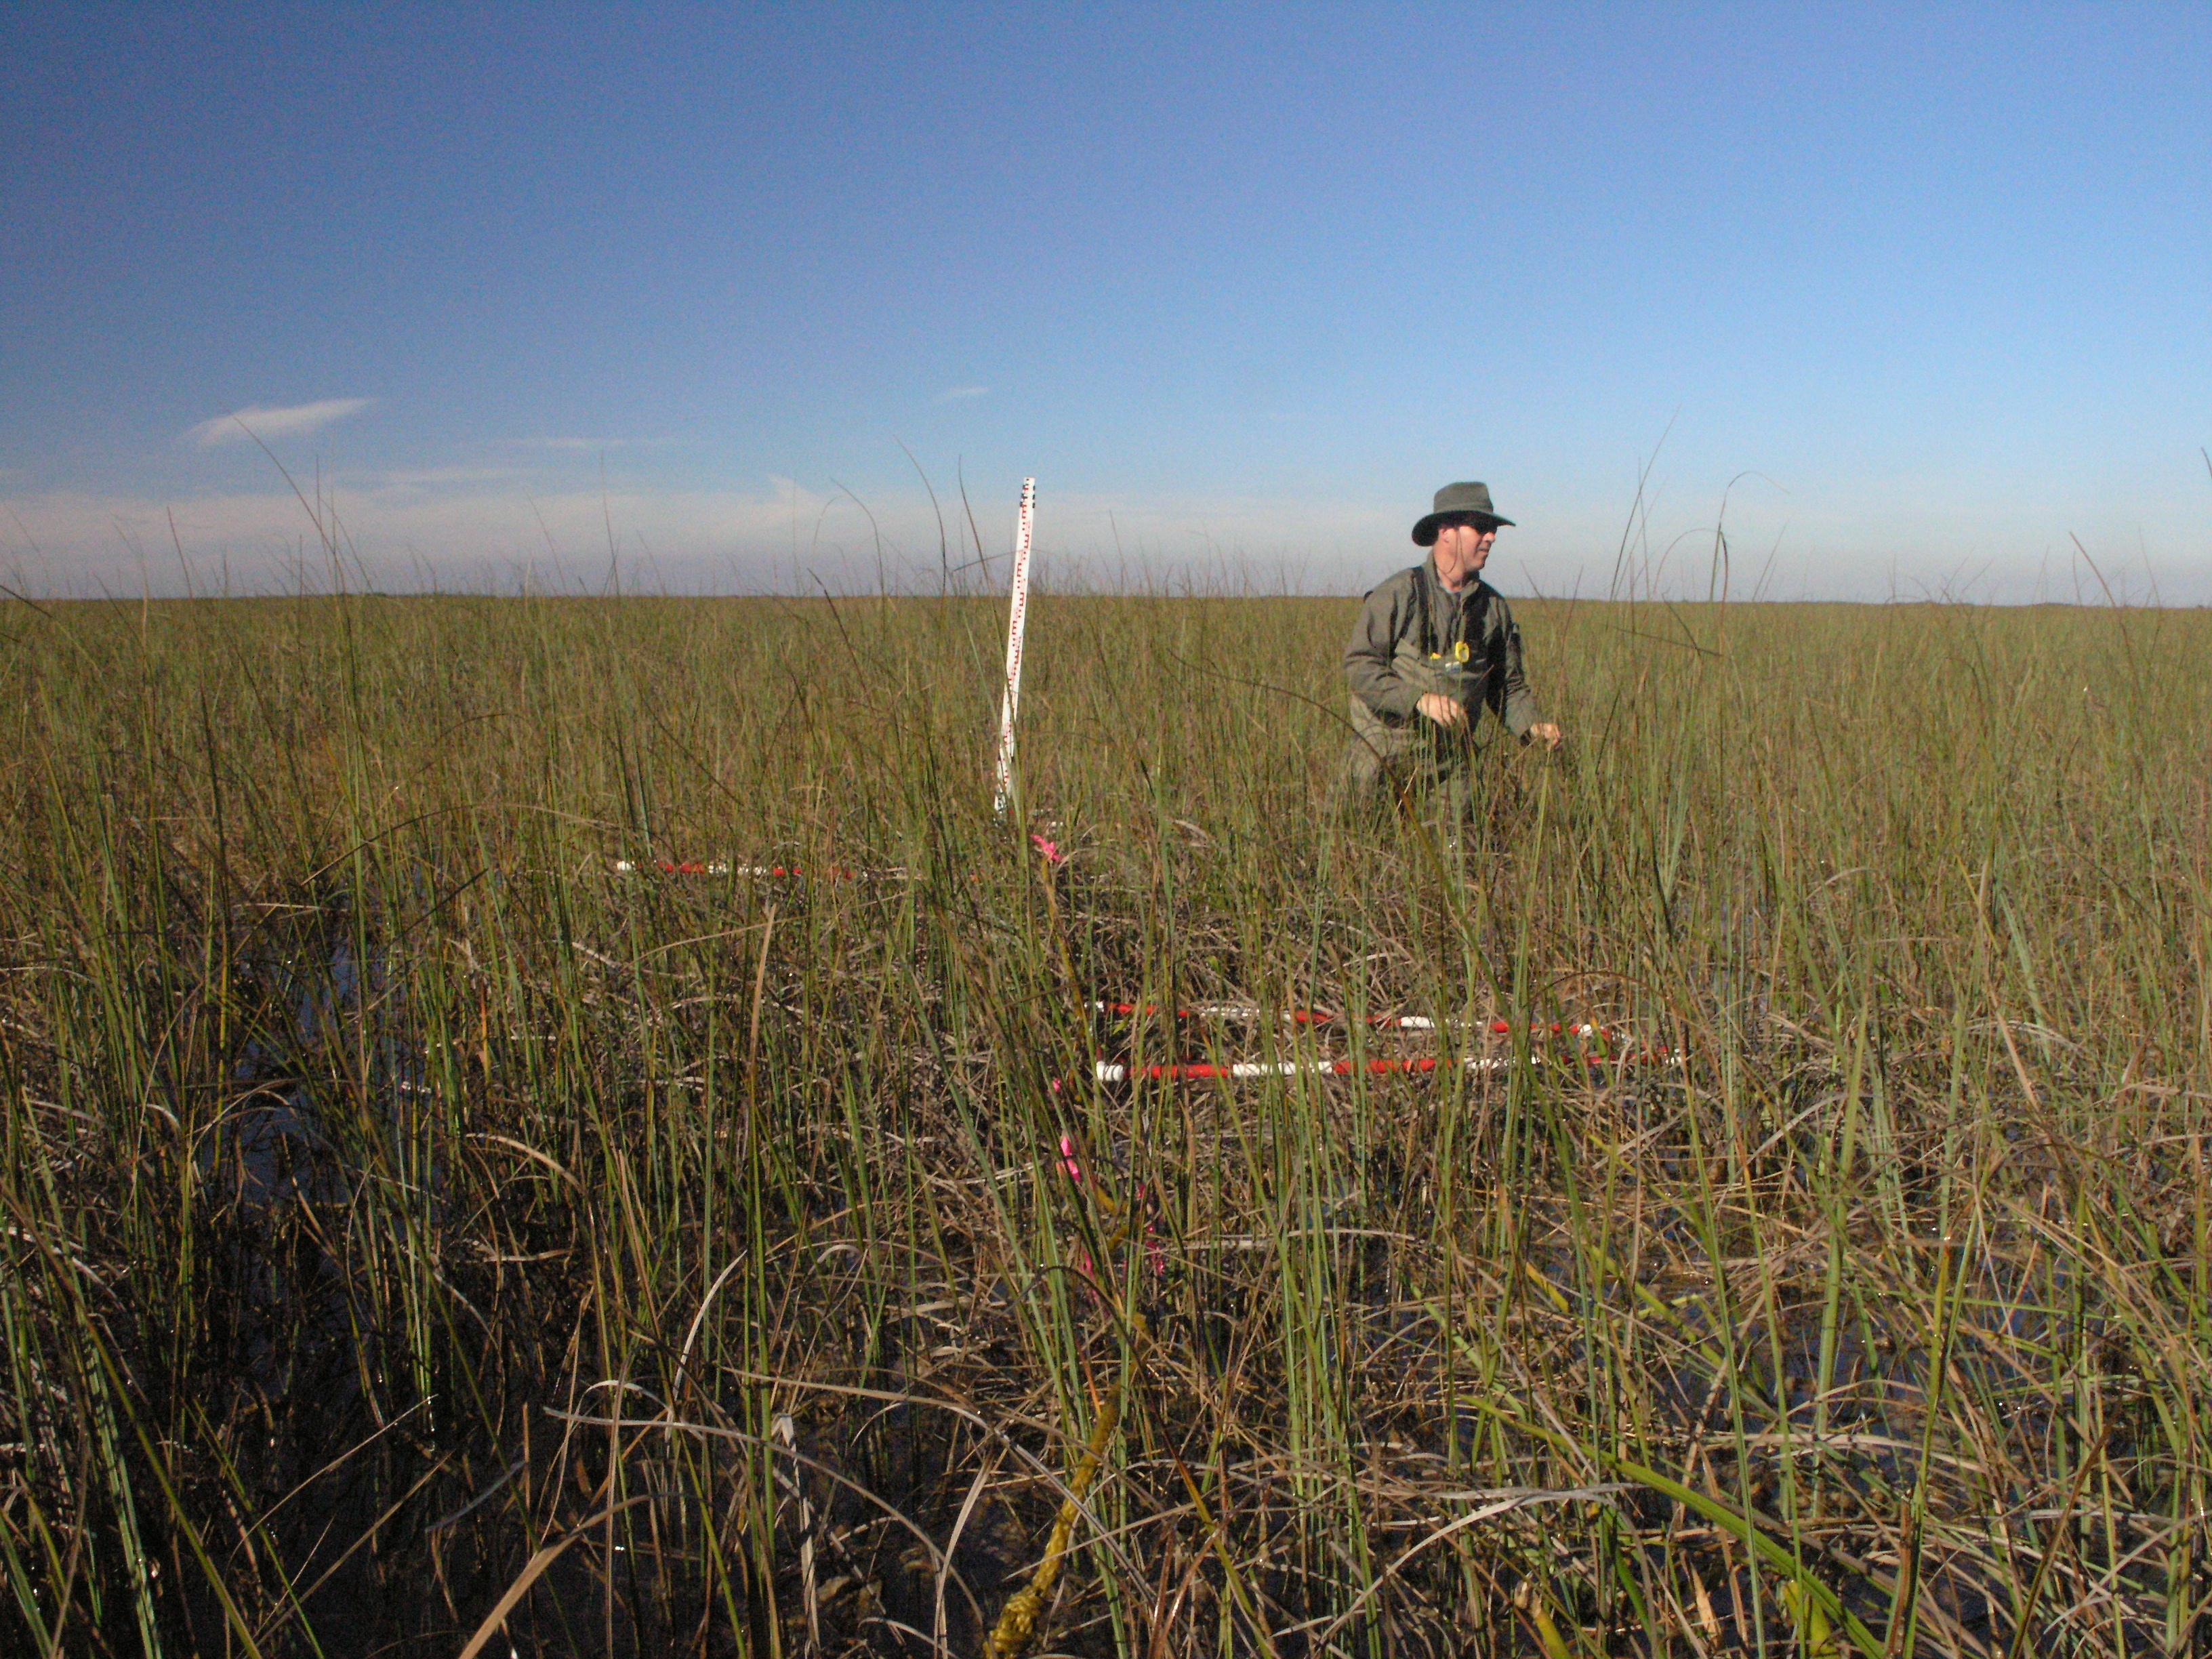
All sites sampled had 1 transect that ran south to north, with the southern end sampled 5 m due west of the biogeochemical sampling point. If a second “habitat type”, as based on visual assessment of the botanist in the crew, was located within a 50 m radius of the first sampling point, a second transect was done in that habitat.
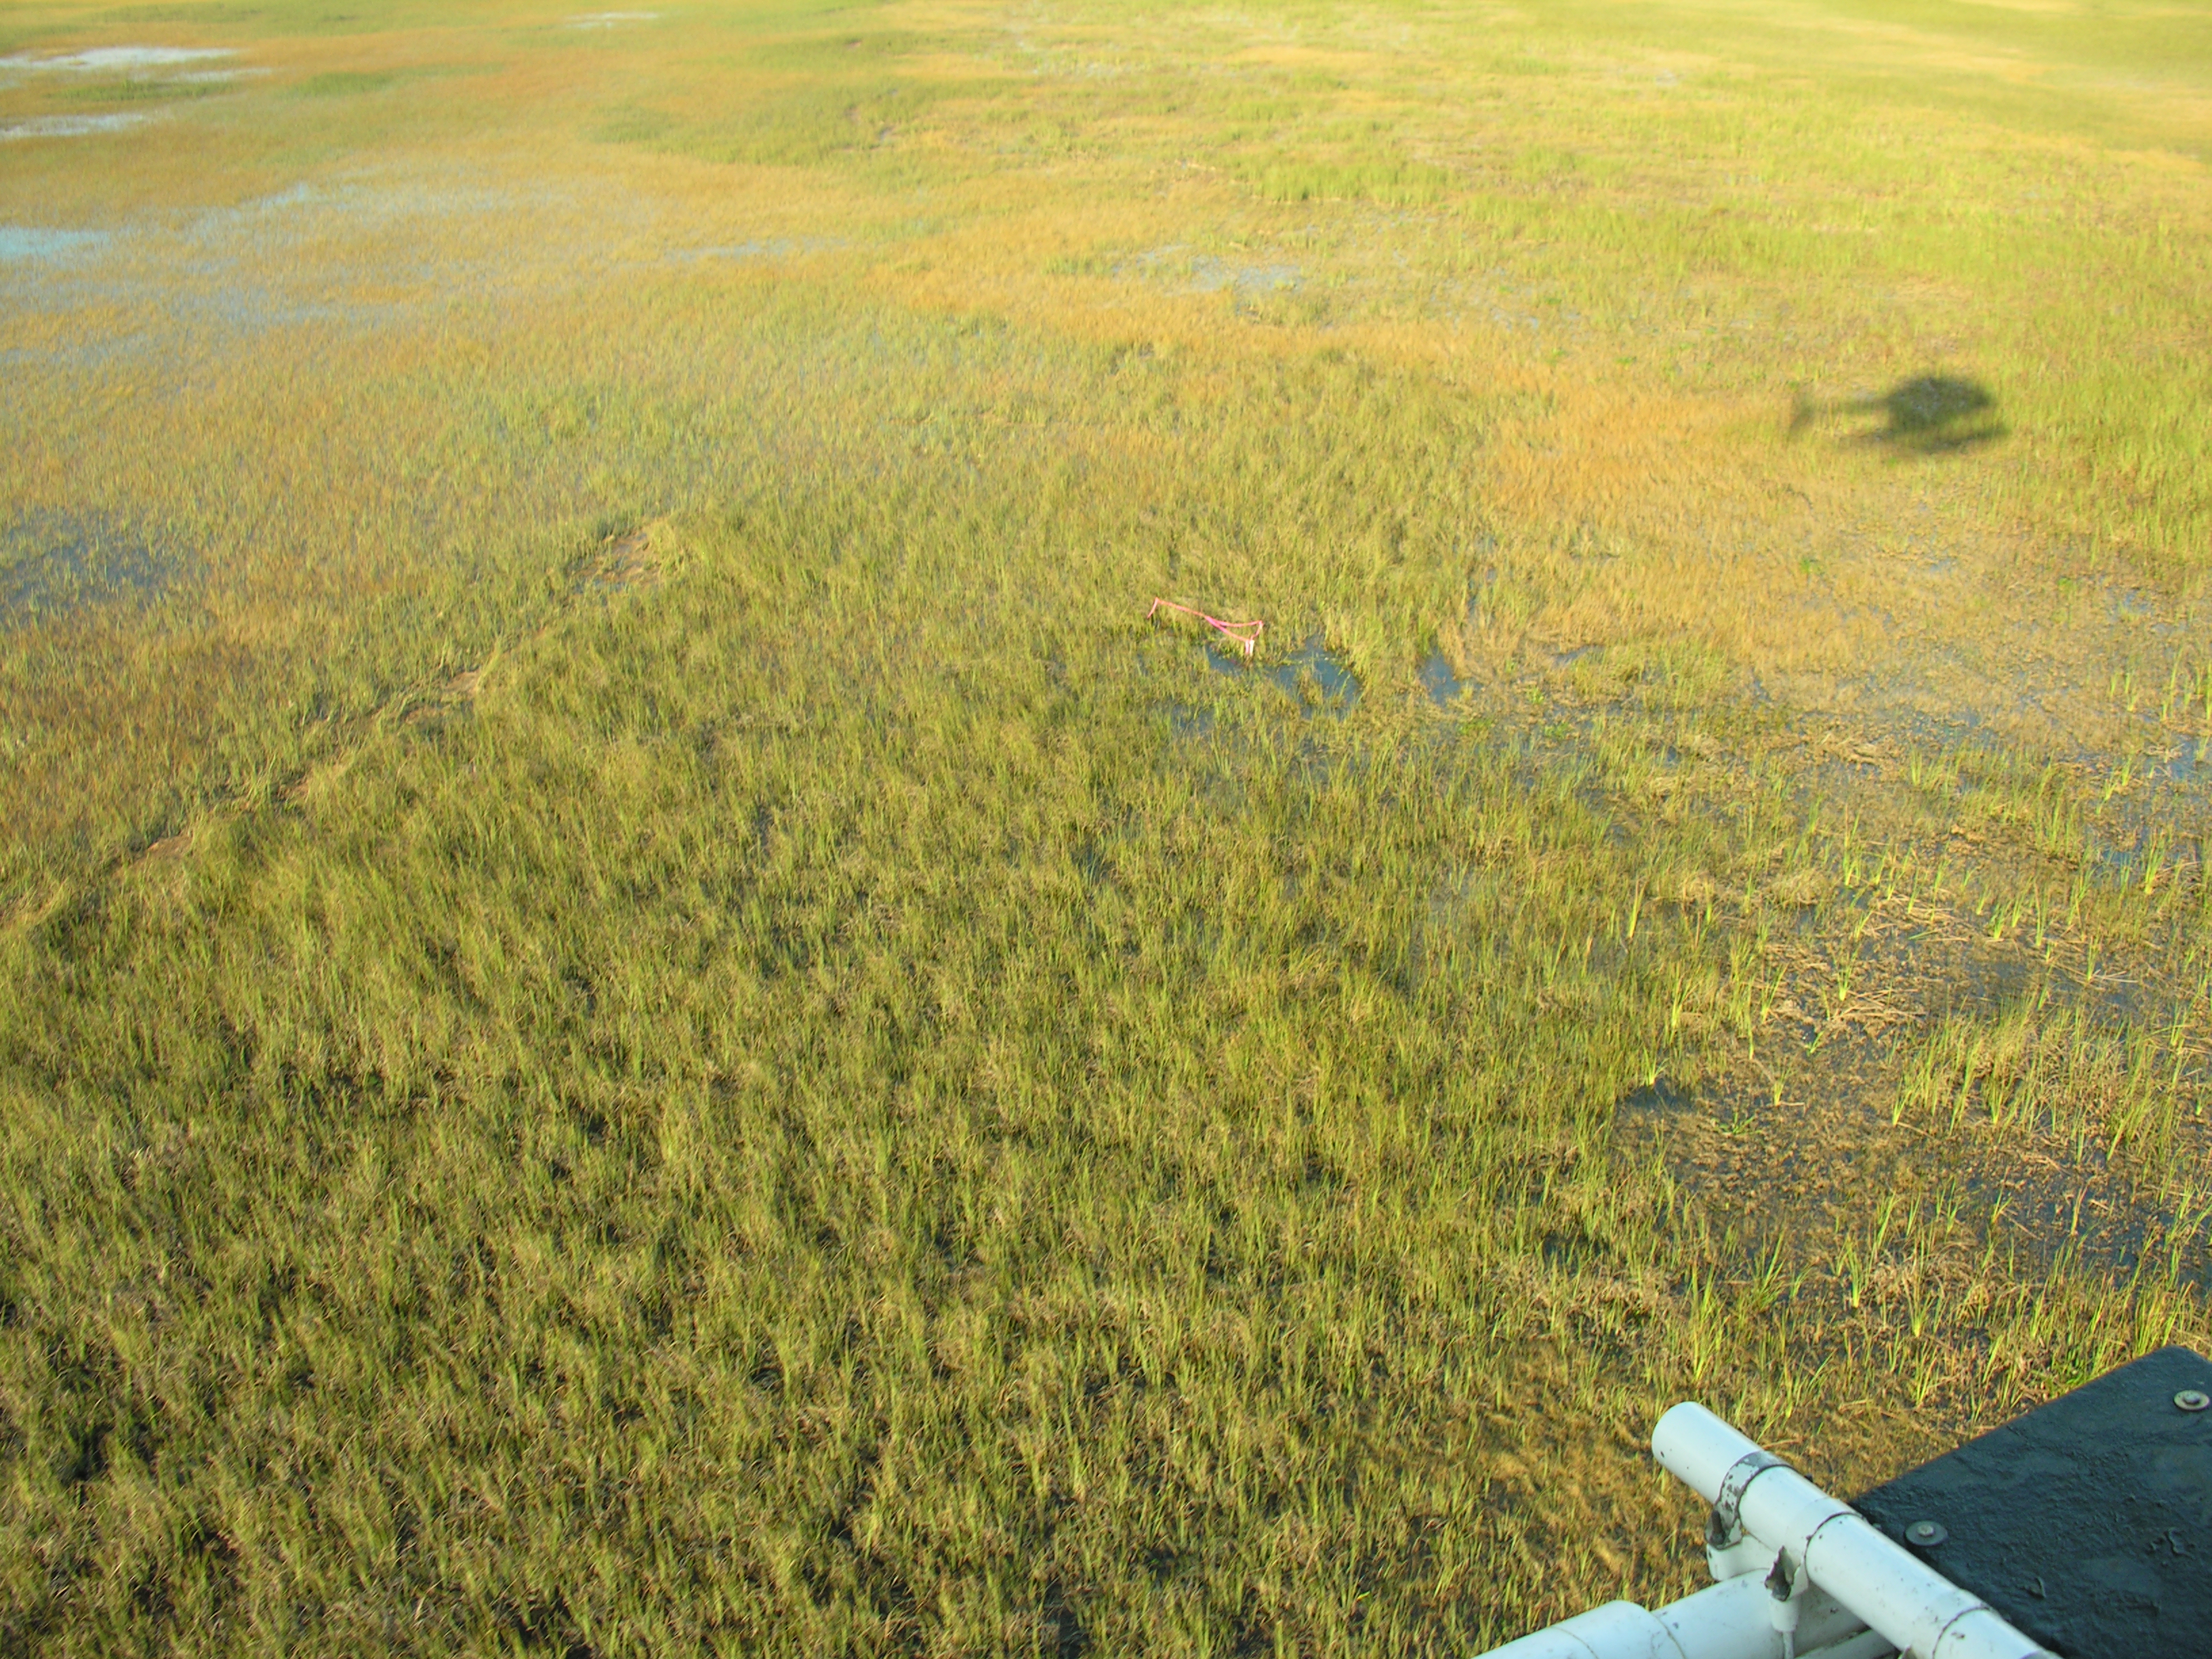
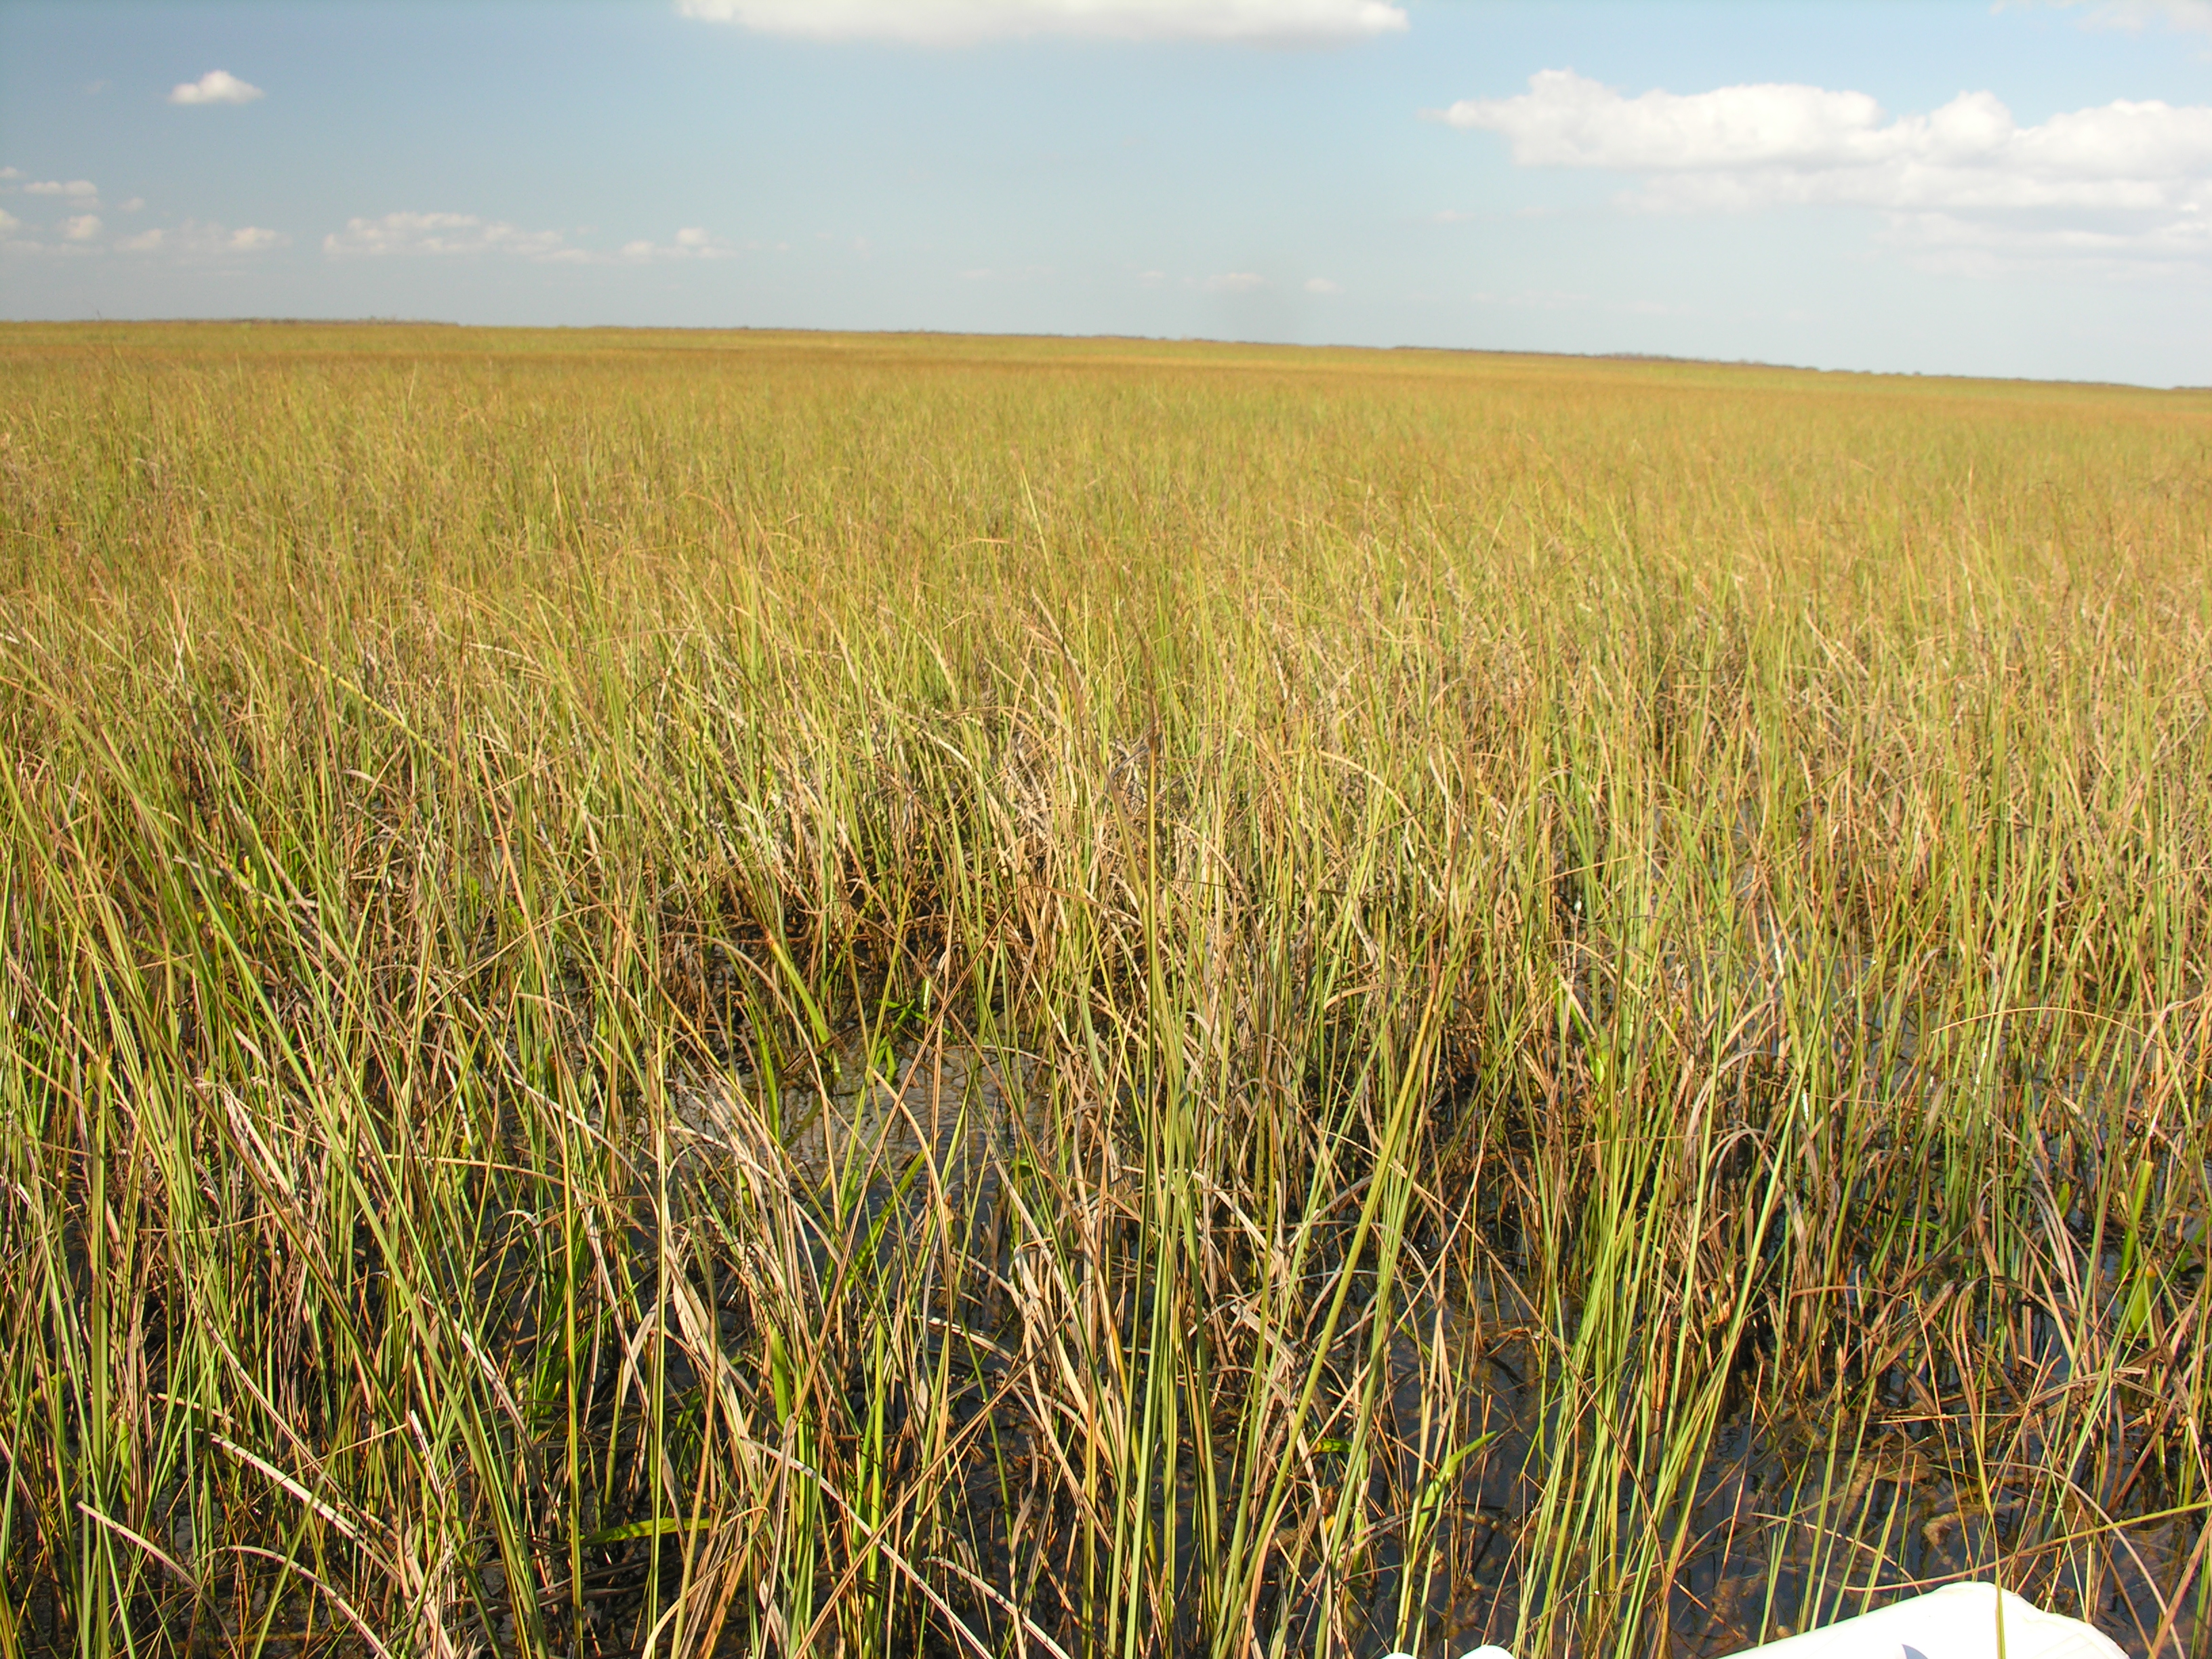
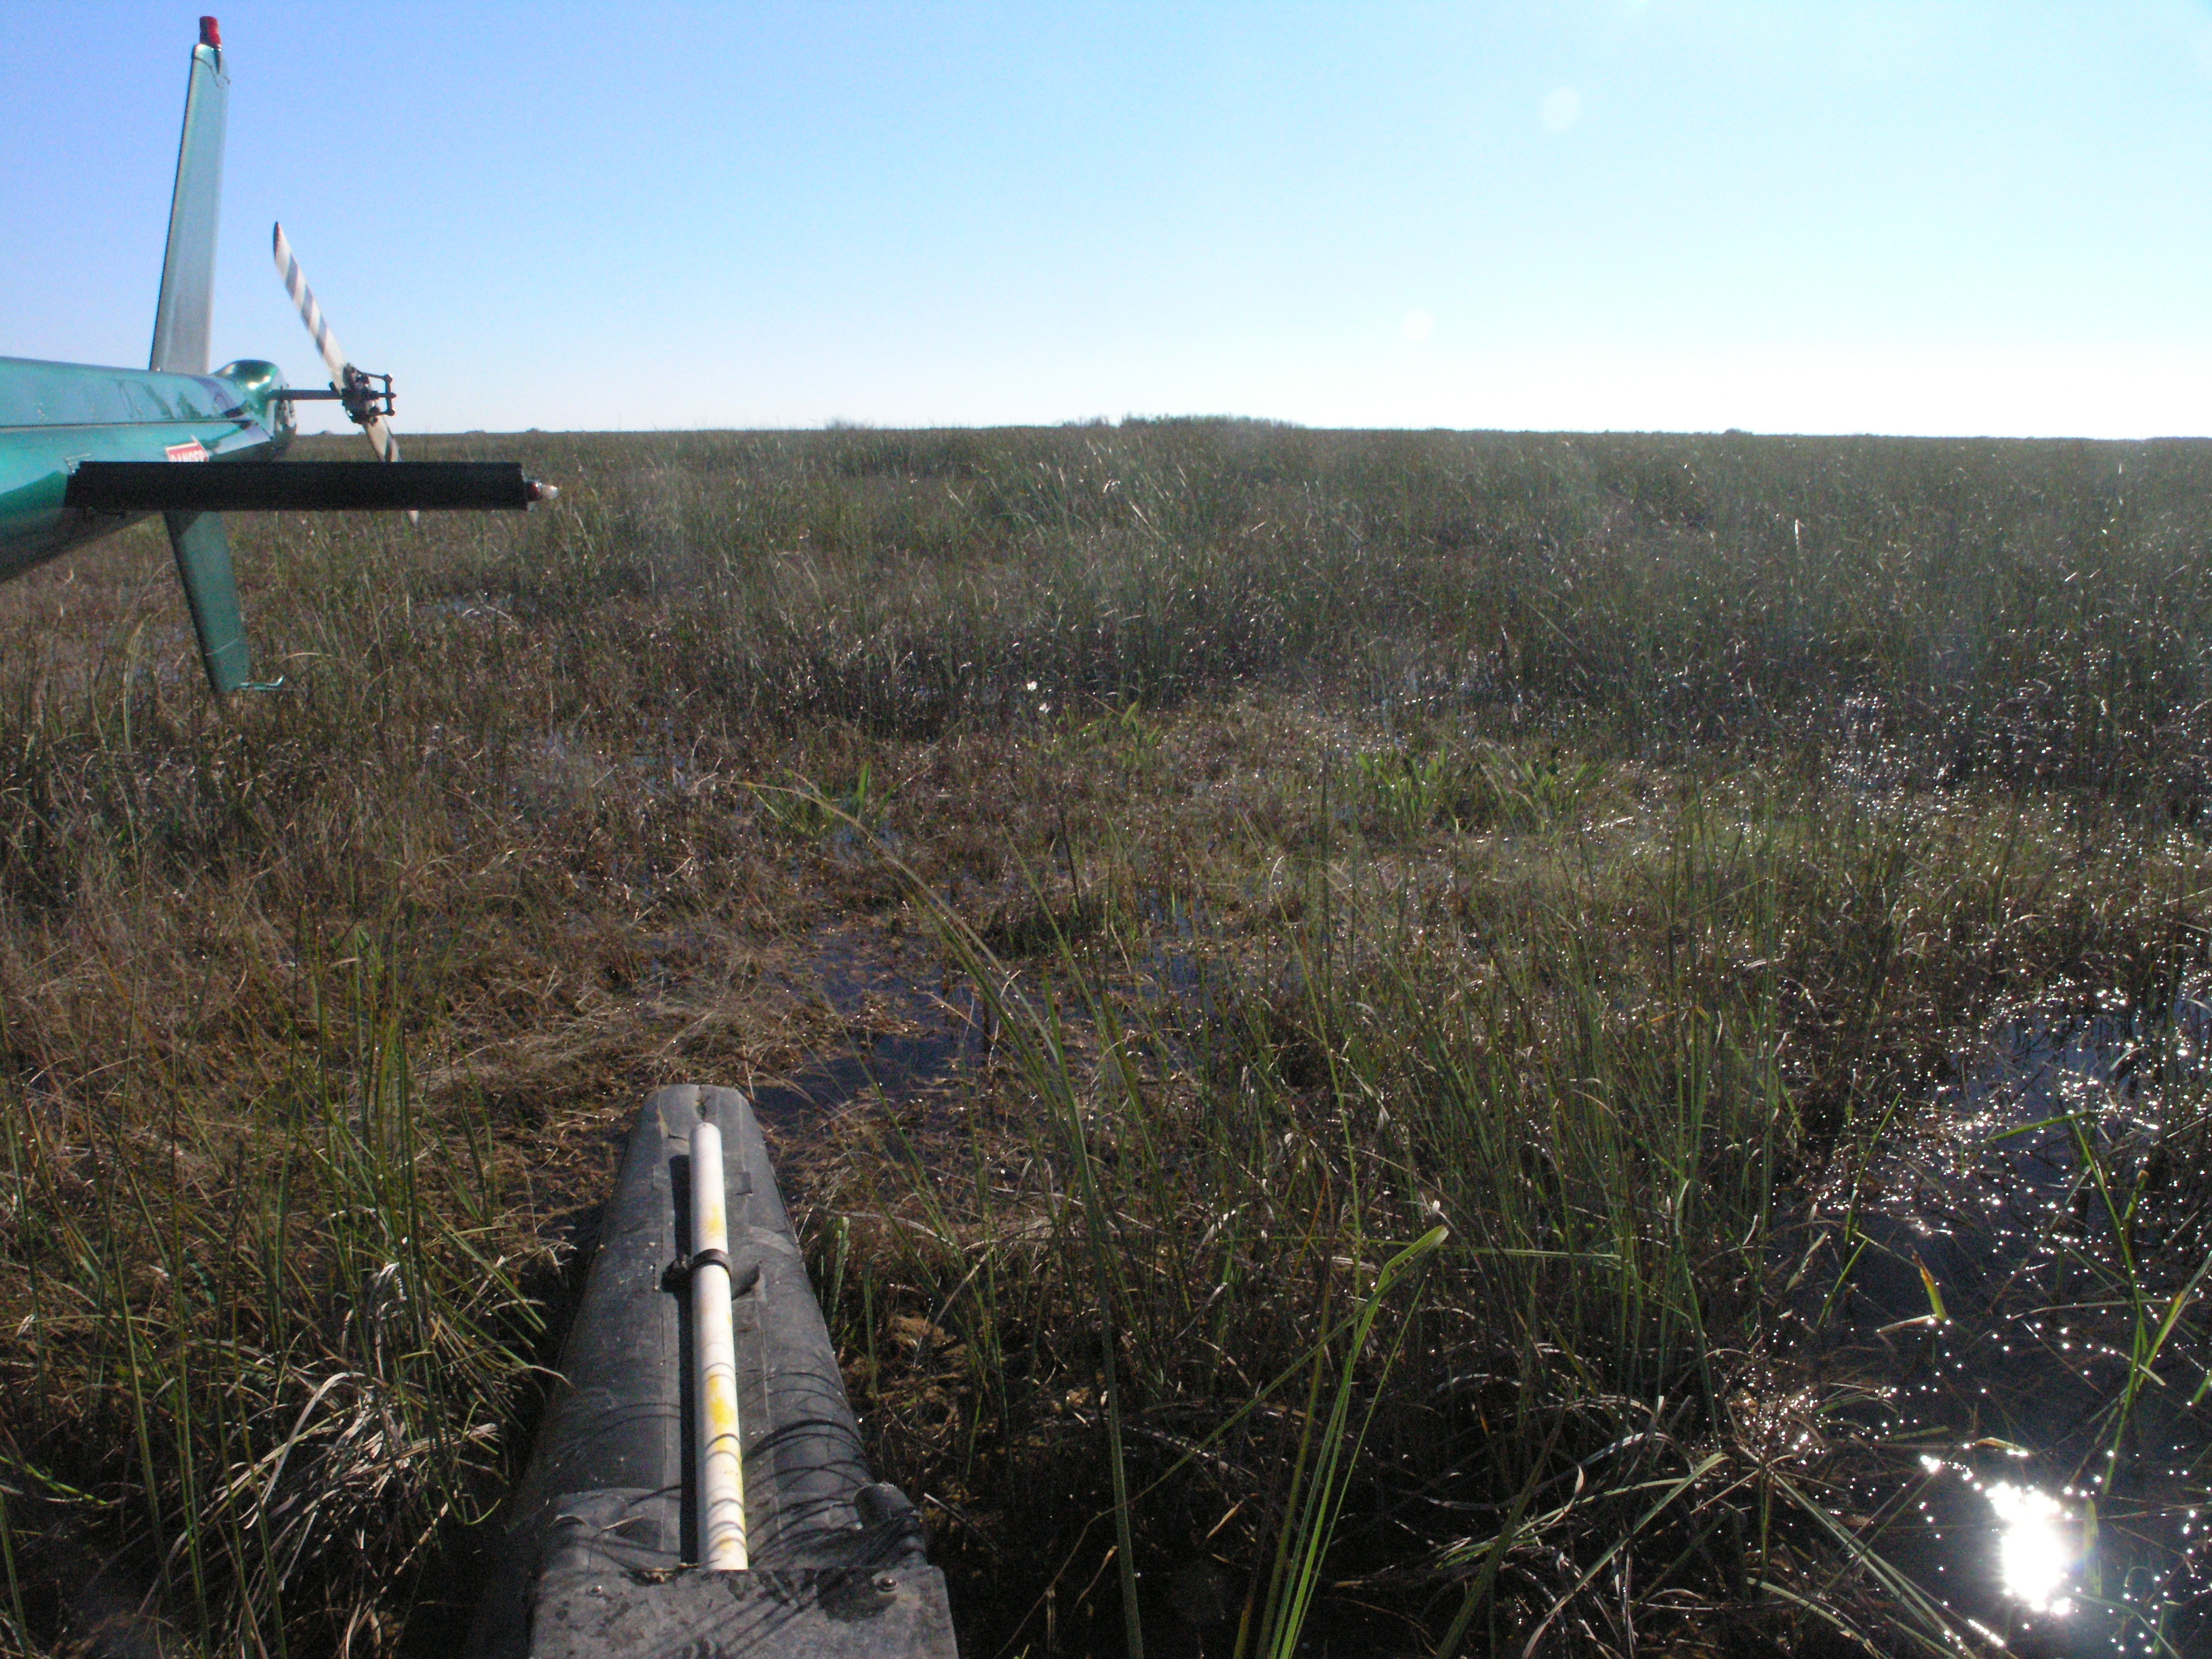
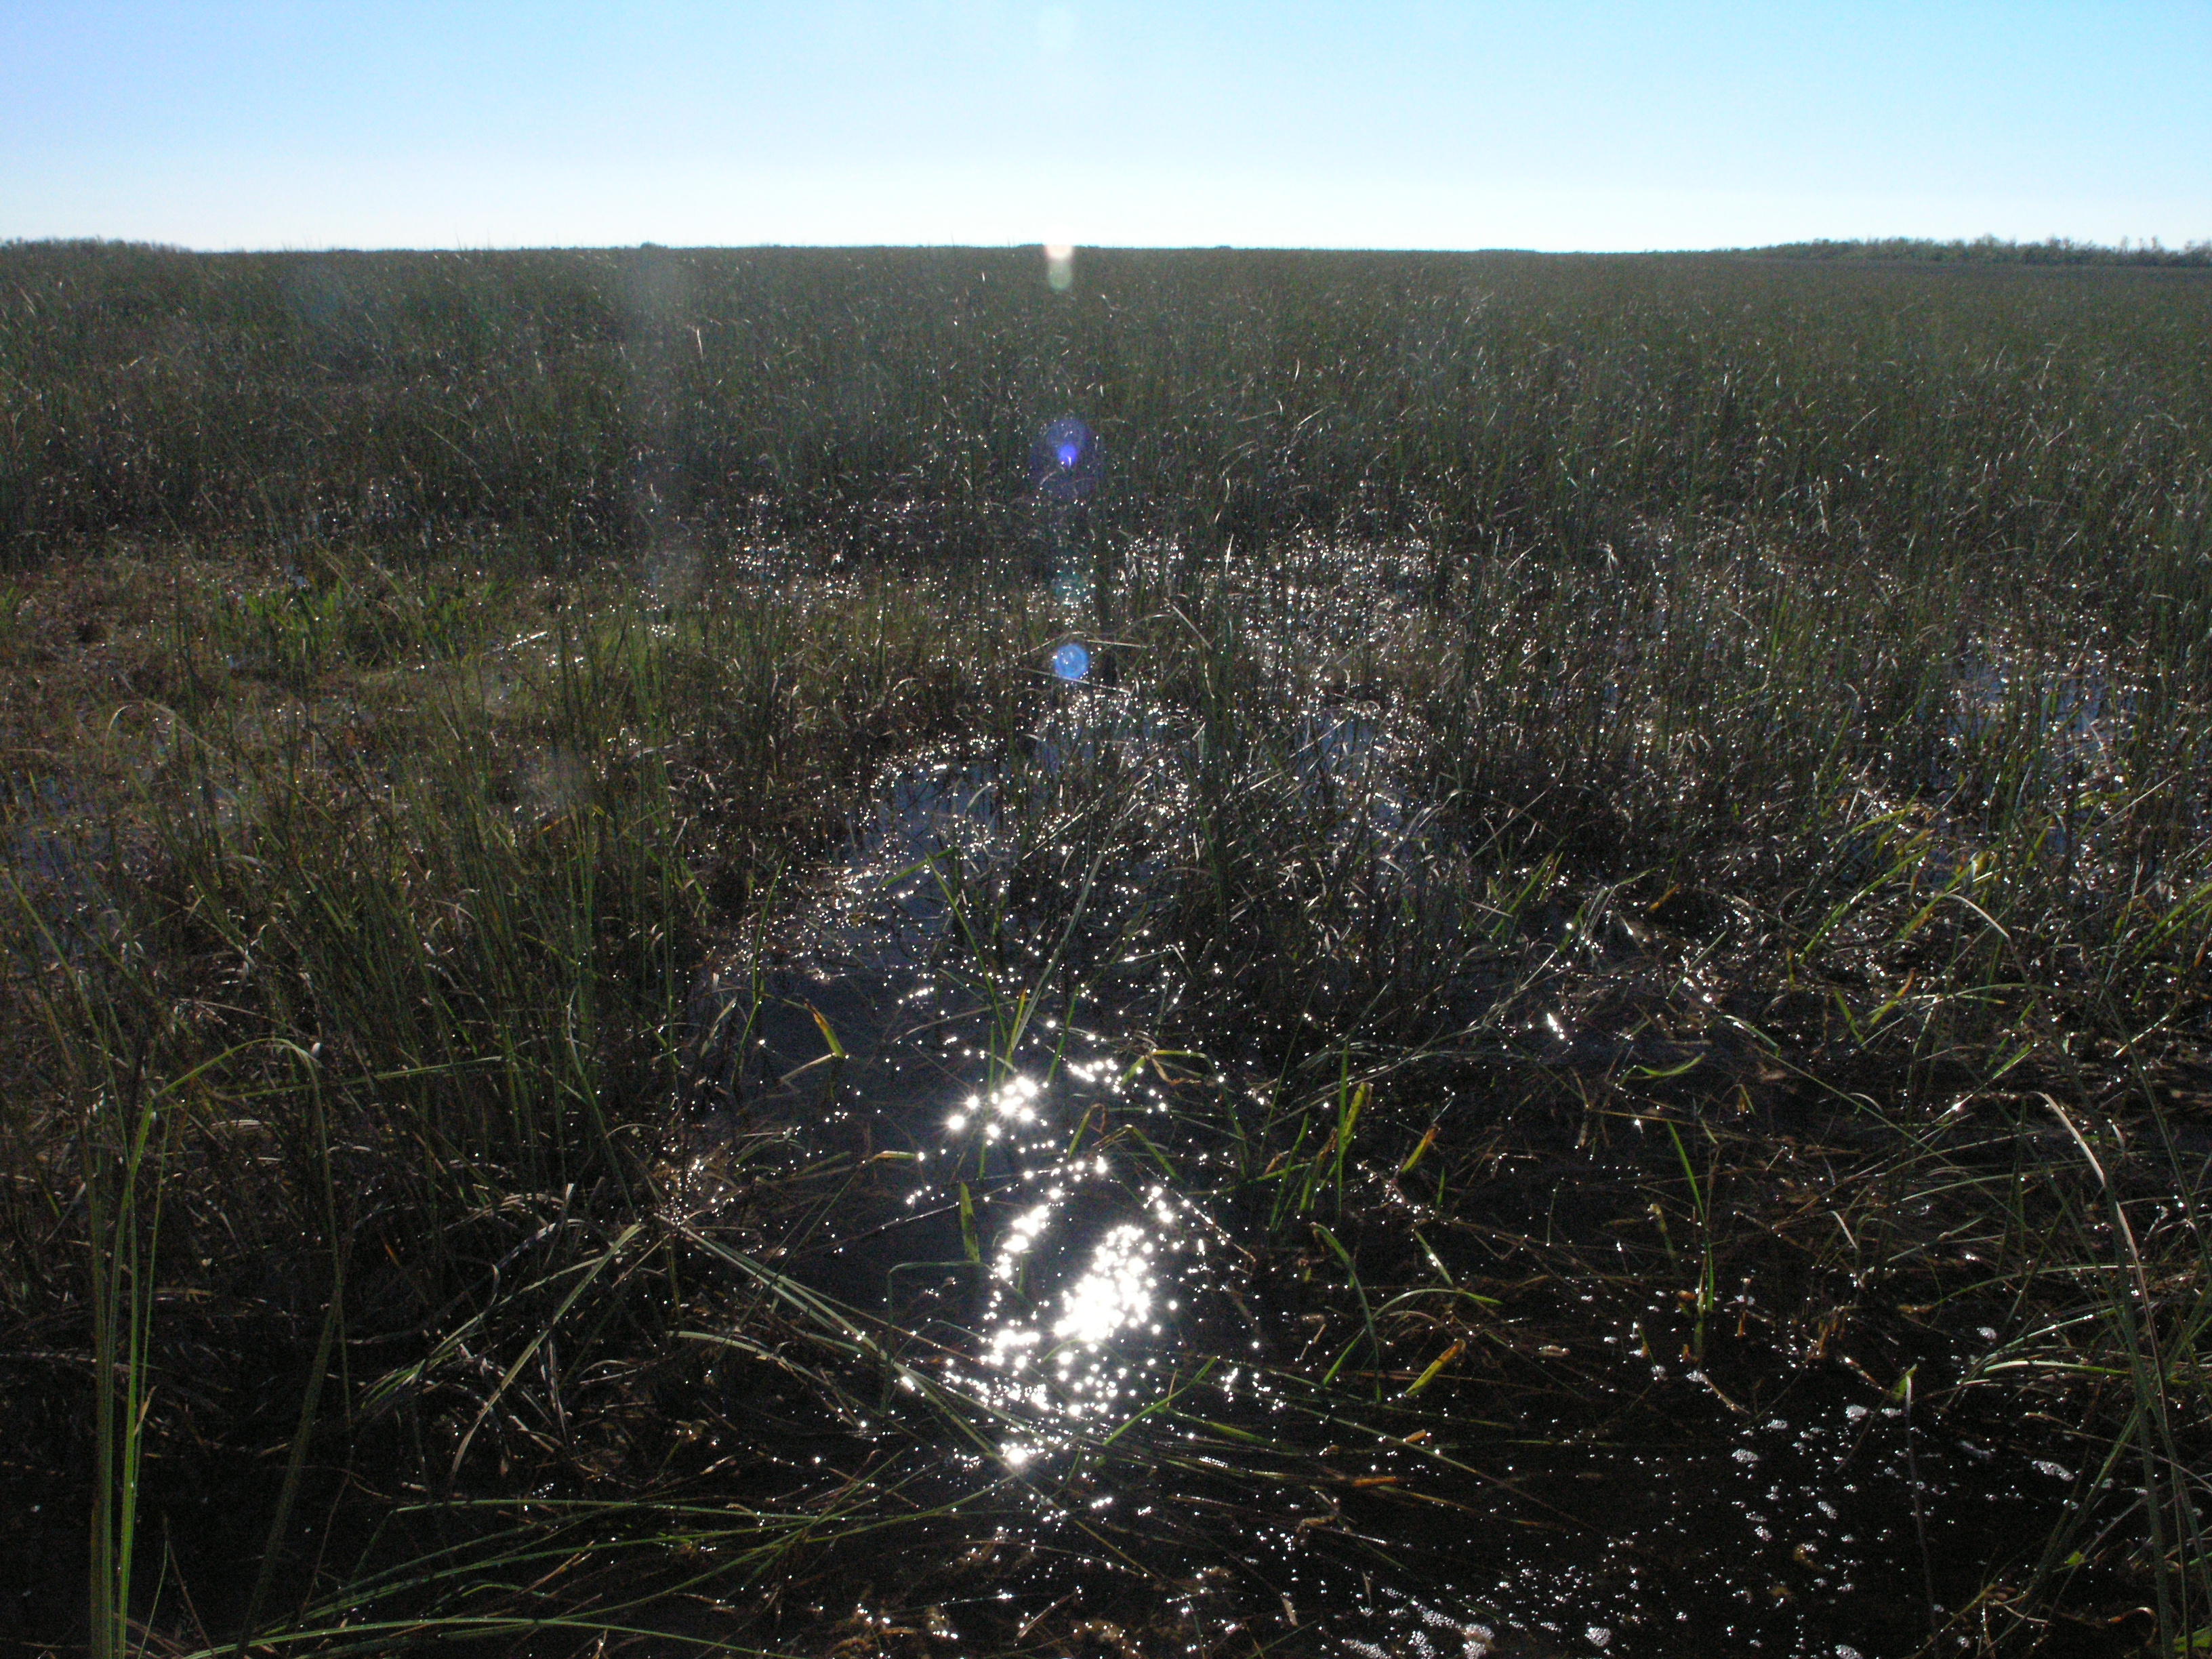
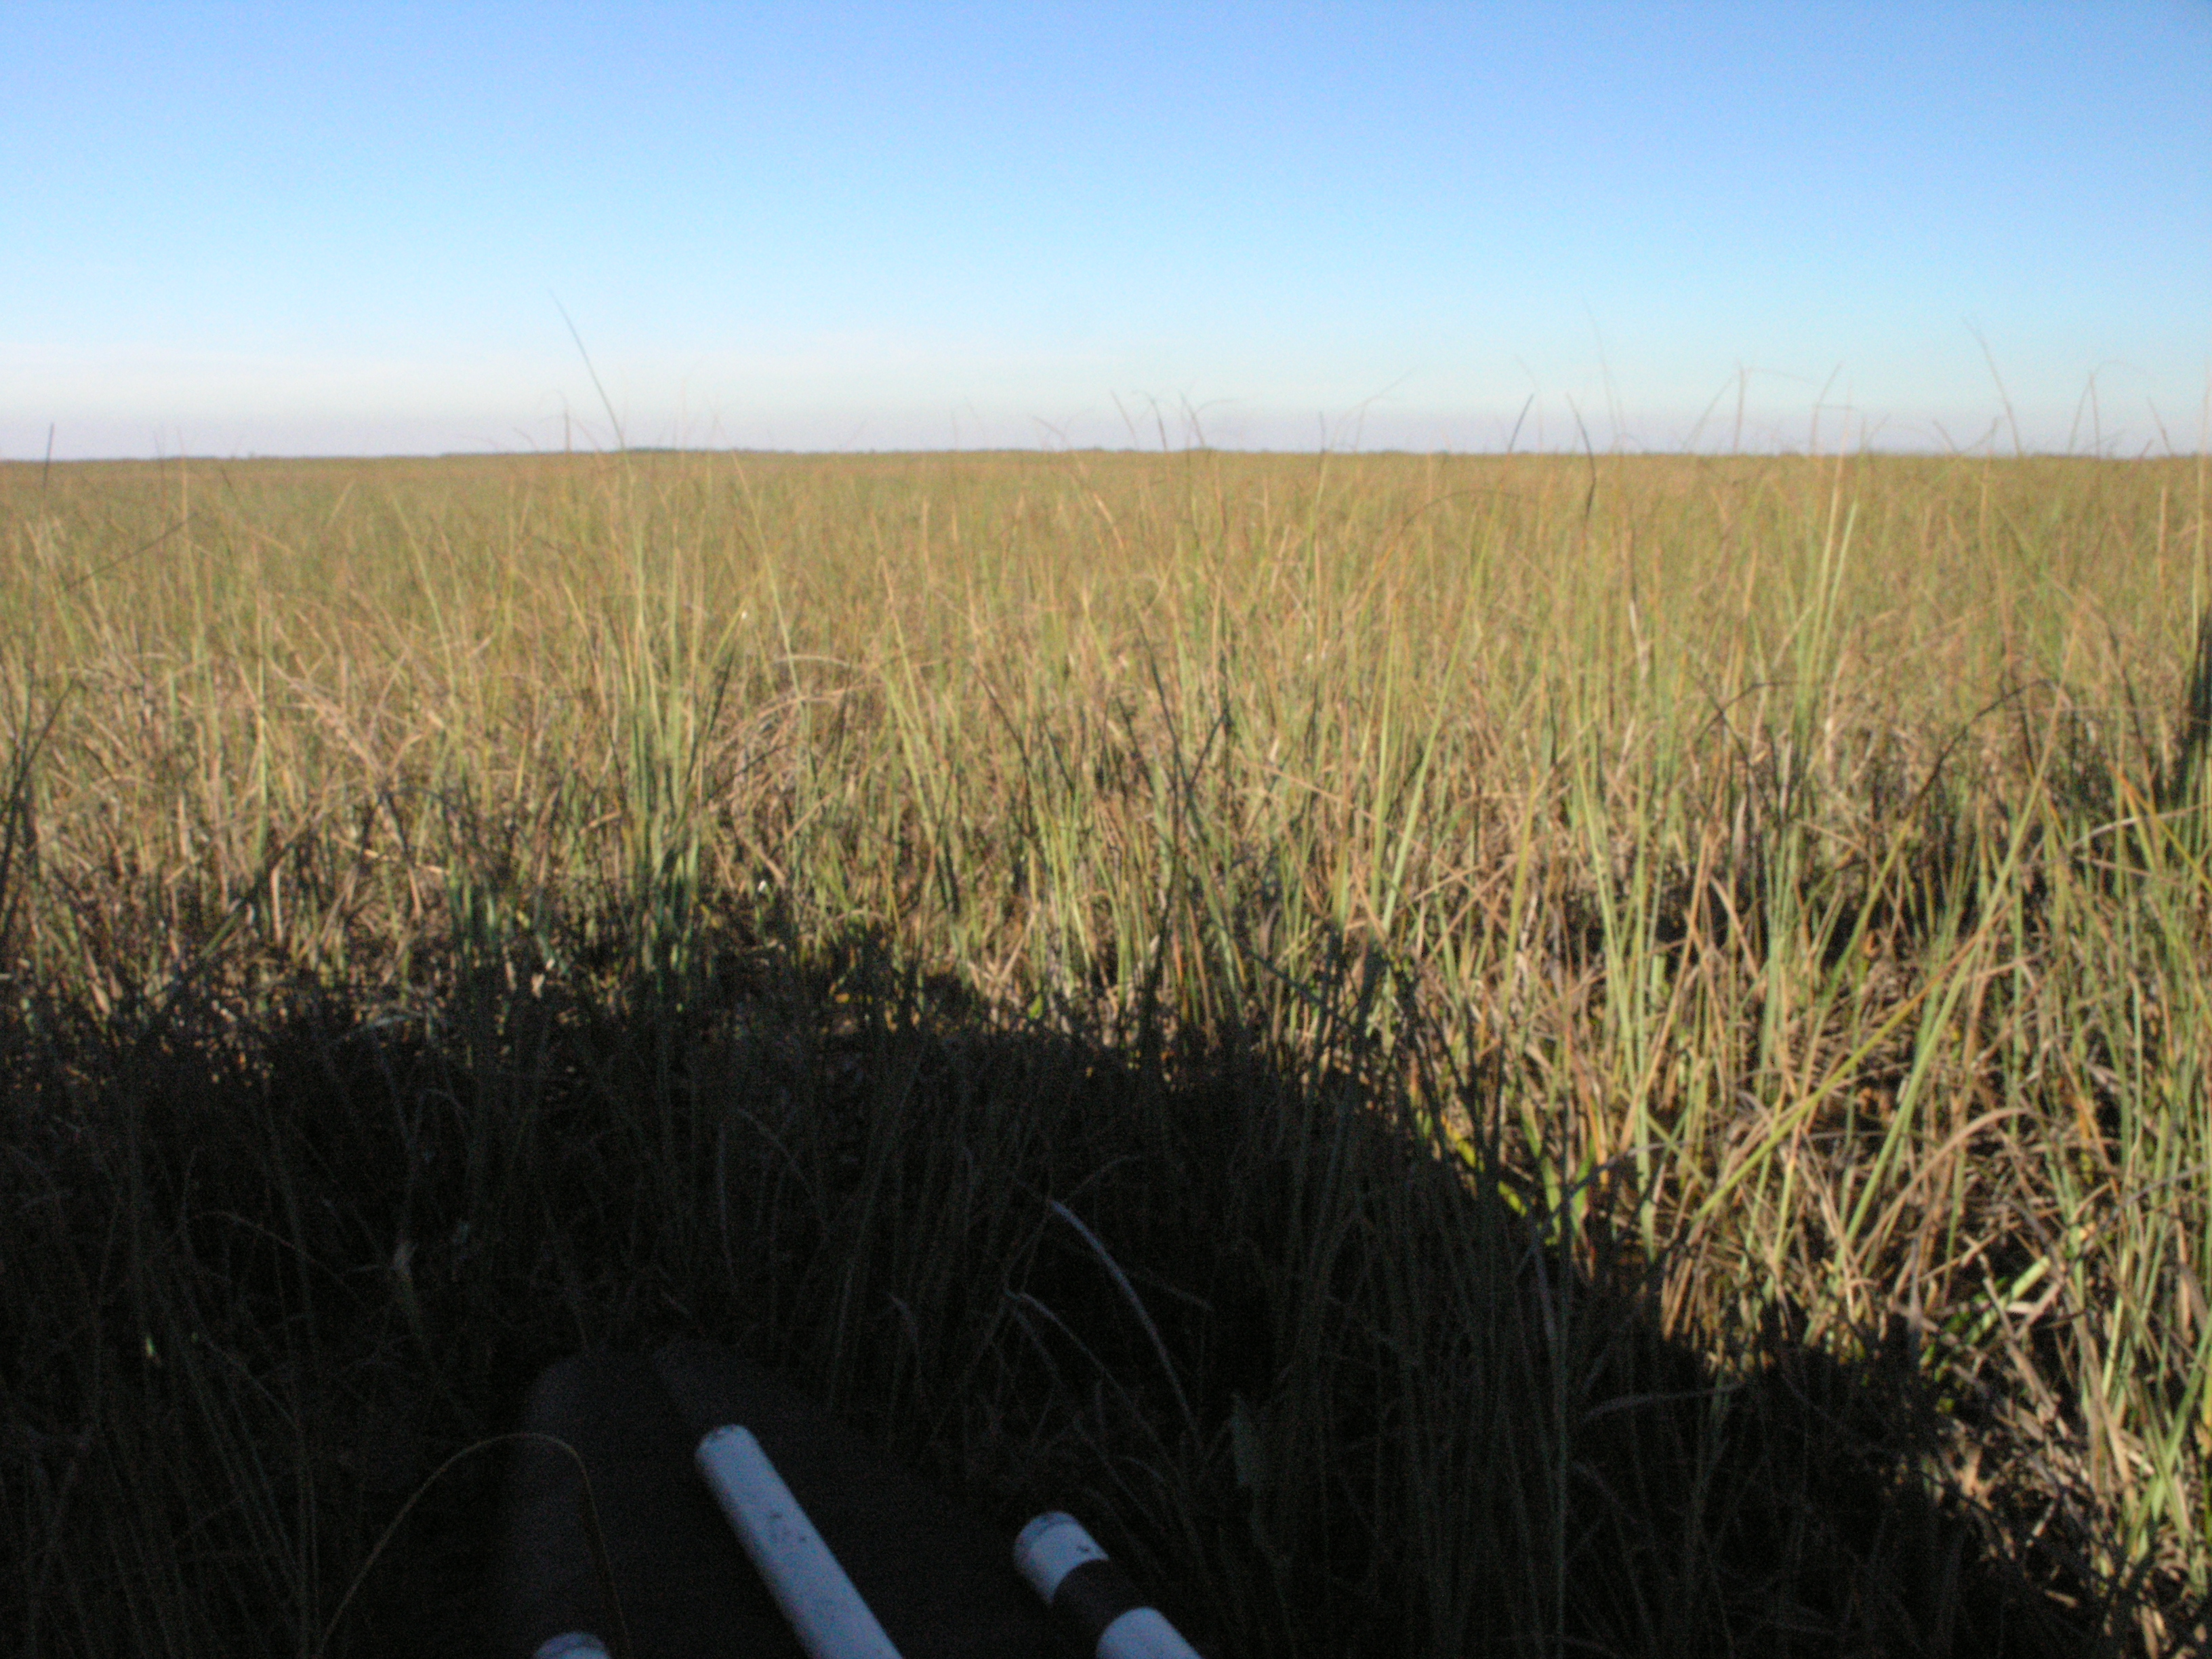
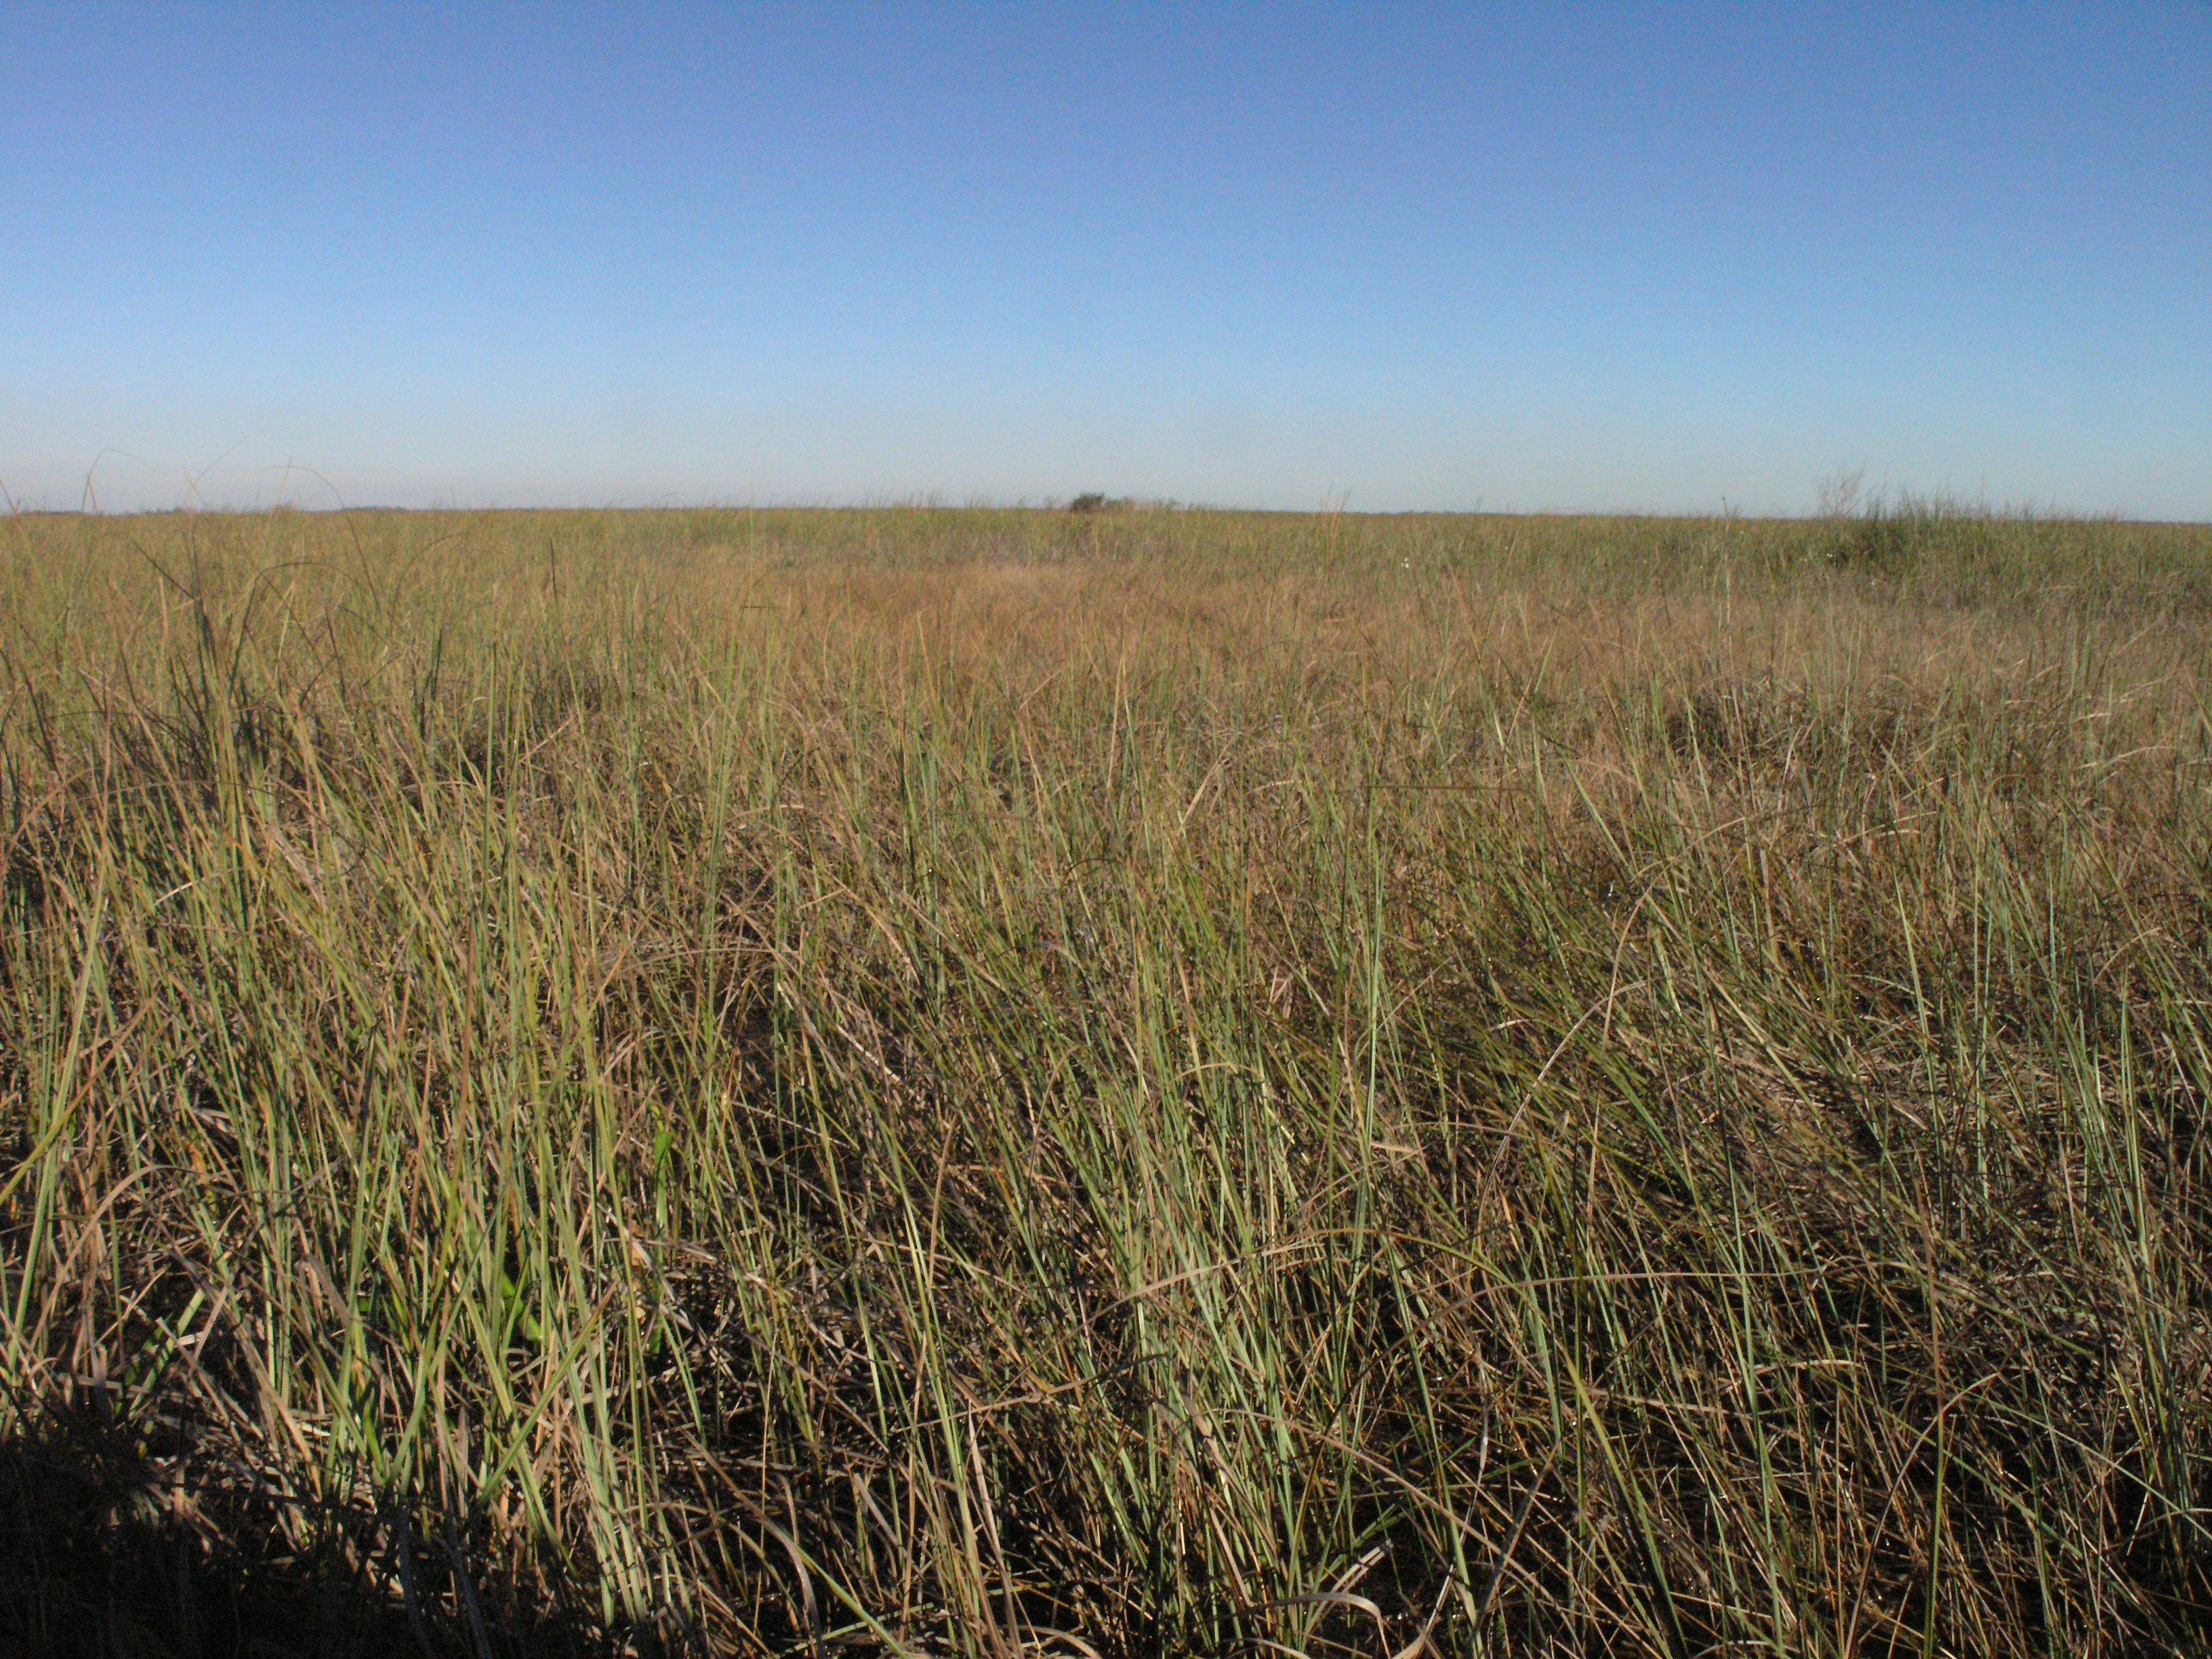
Left Panorama
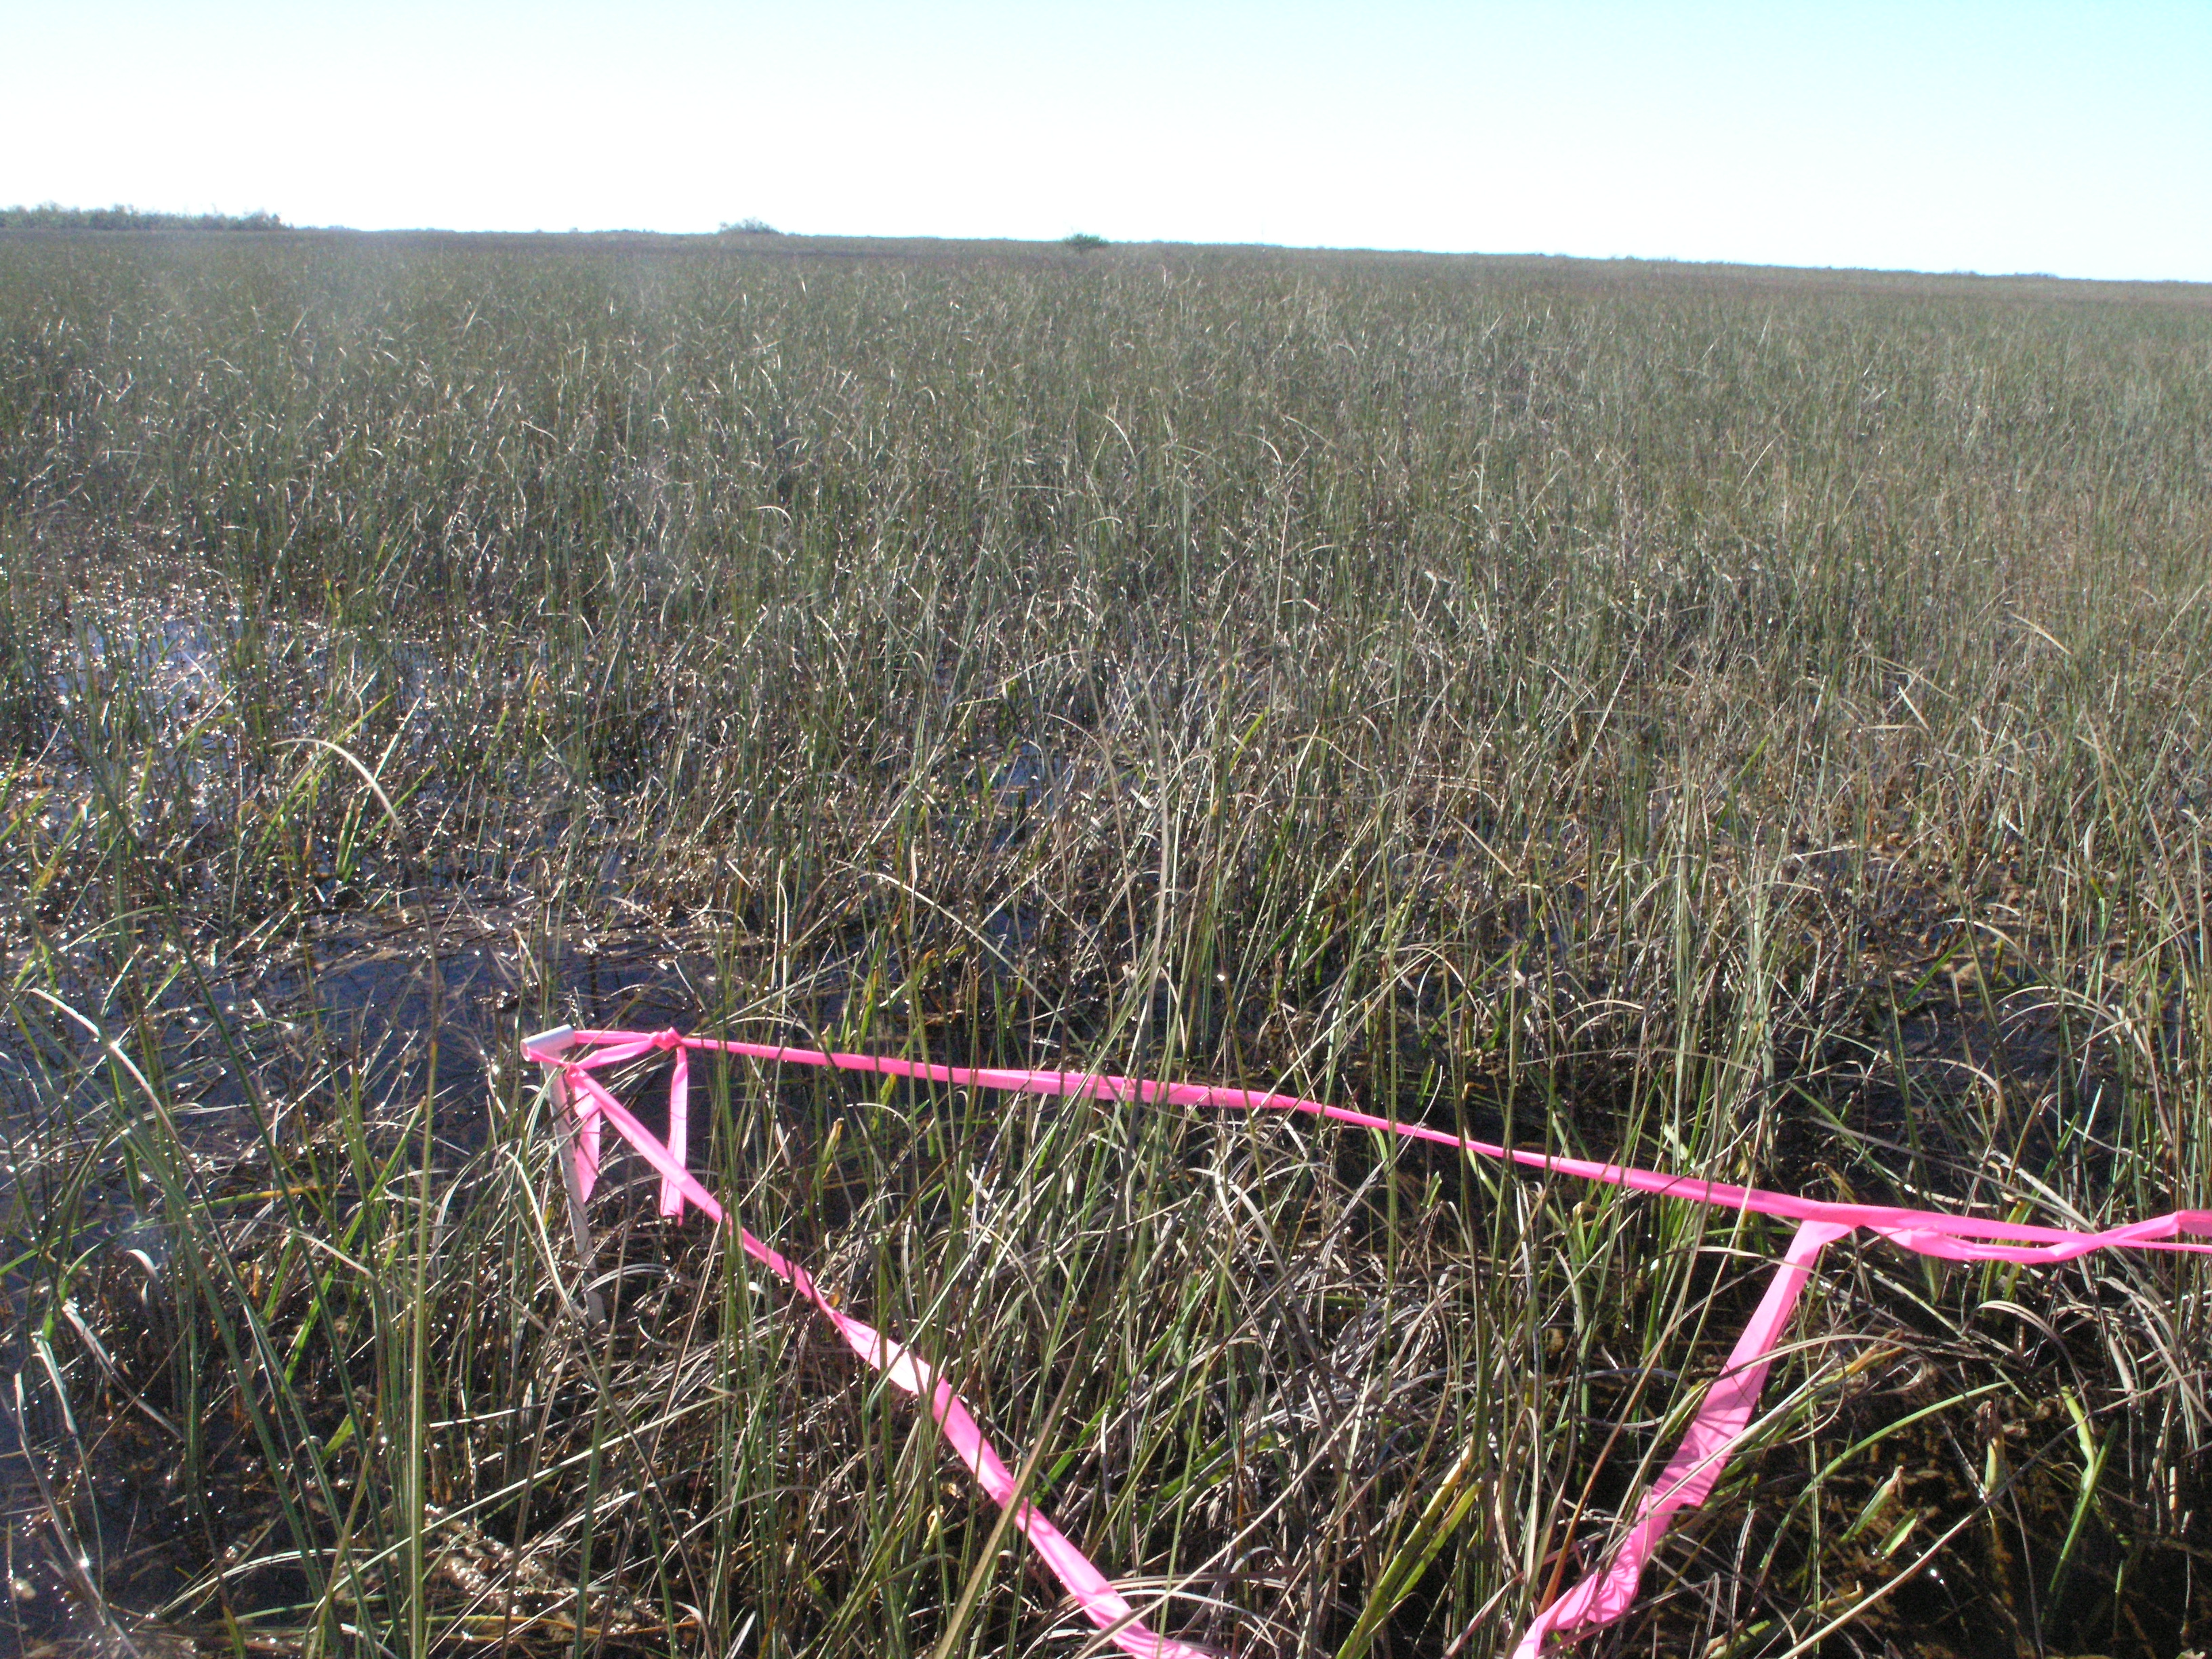
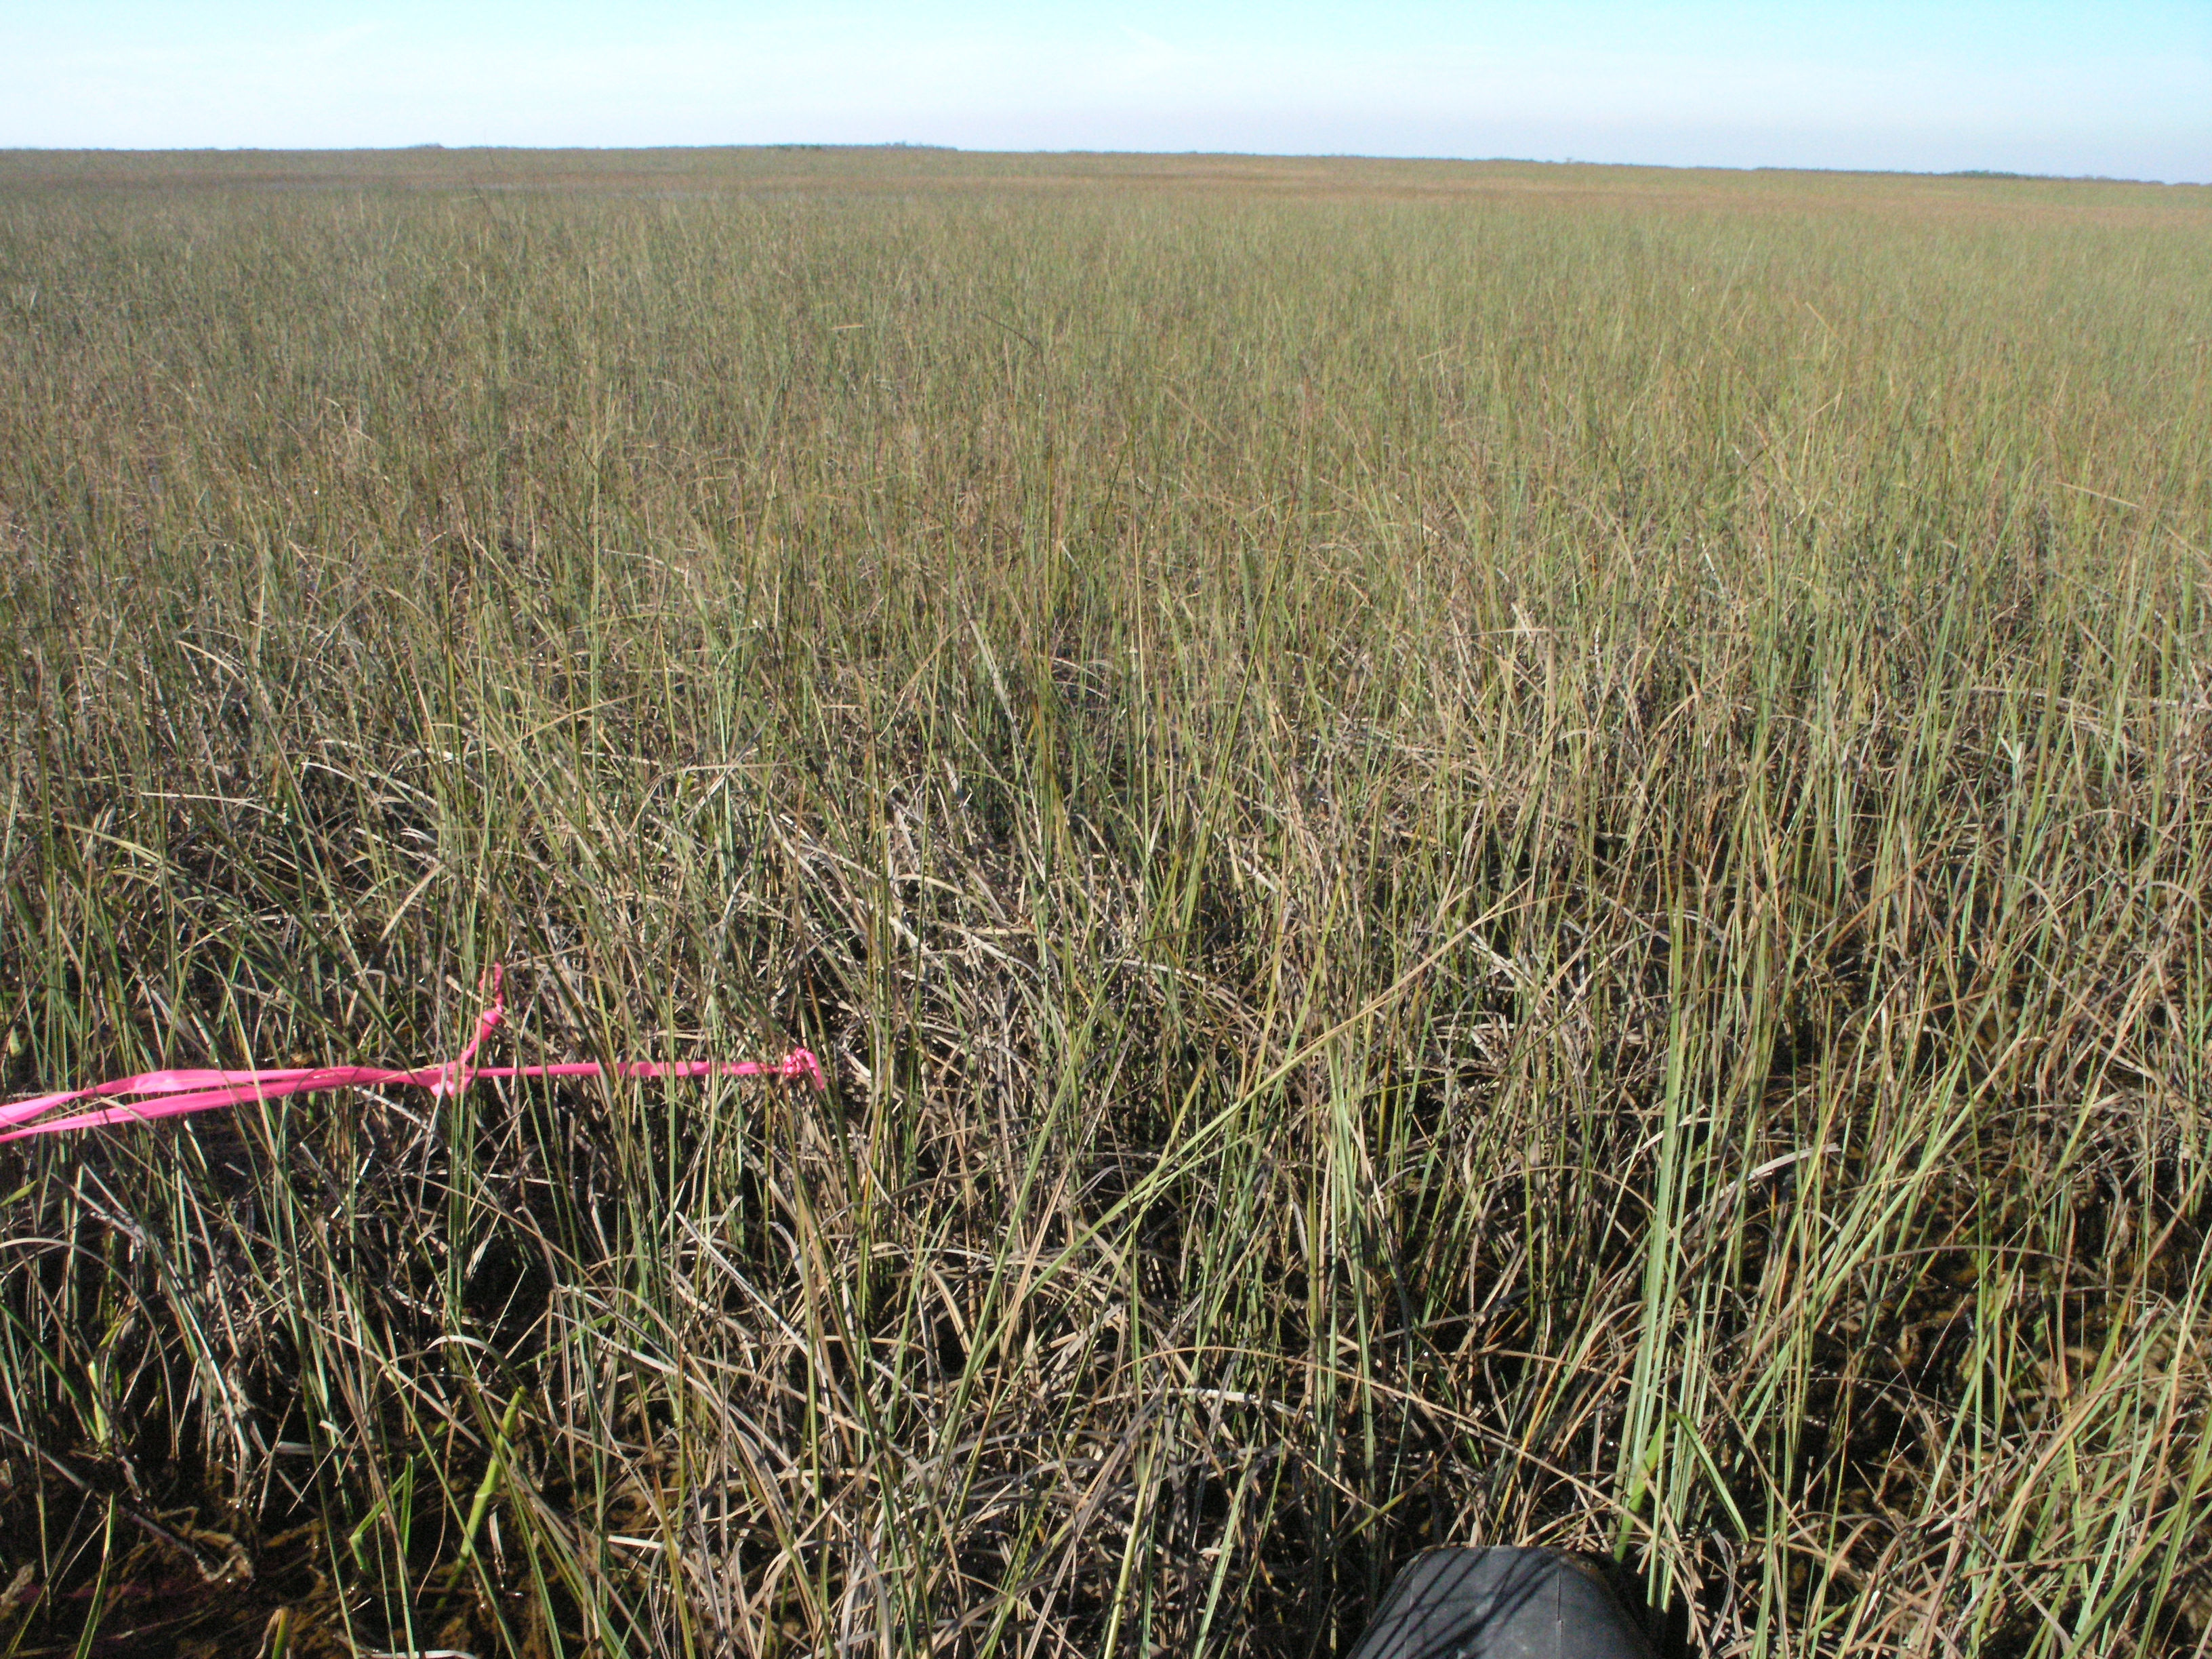
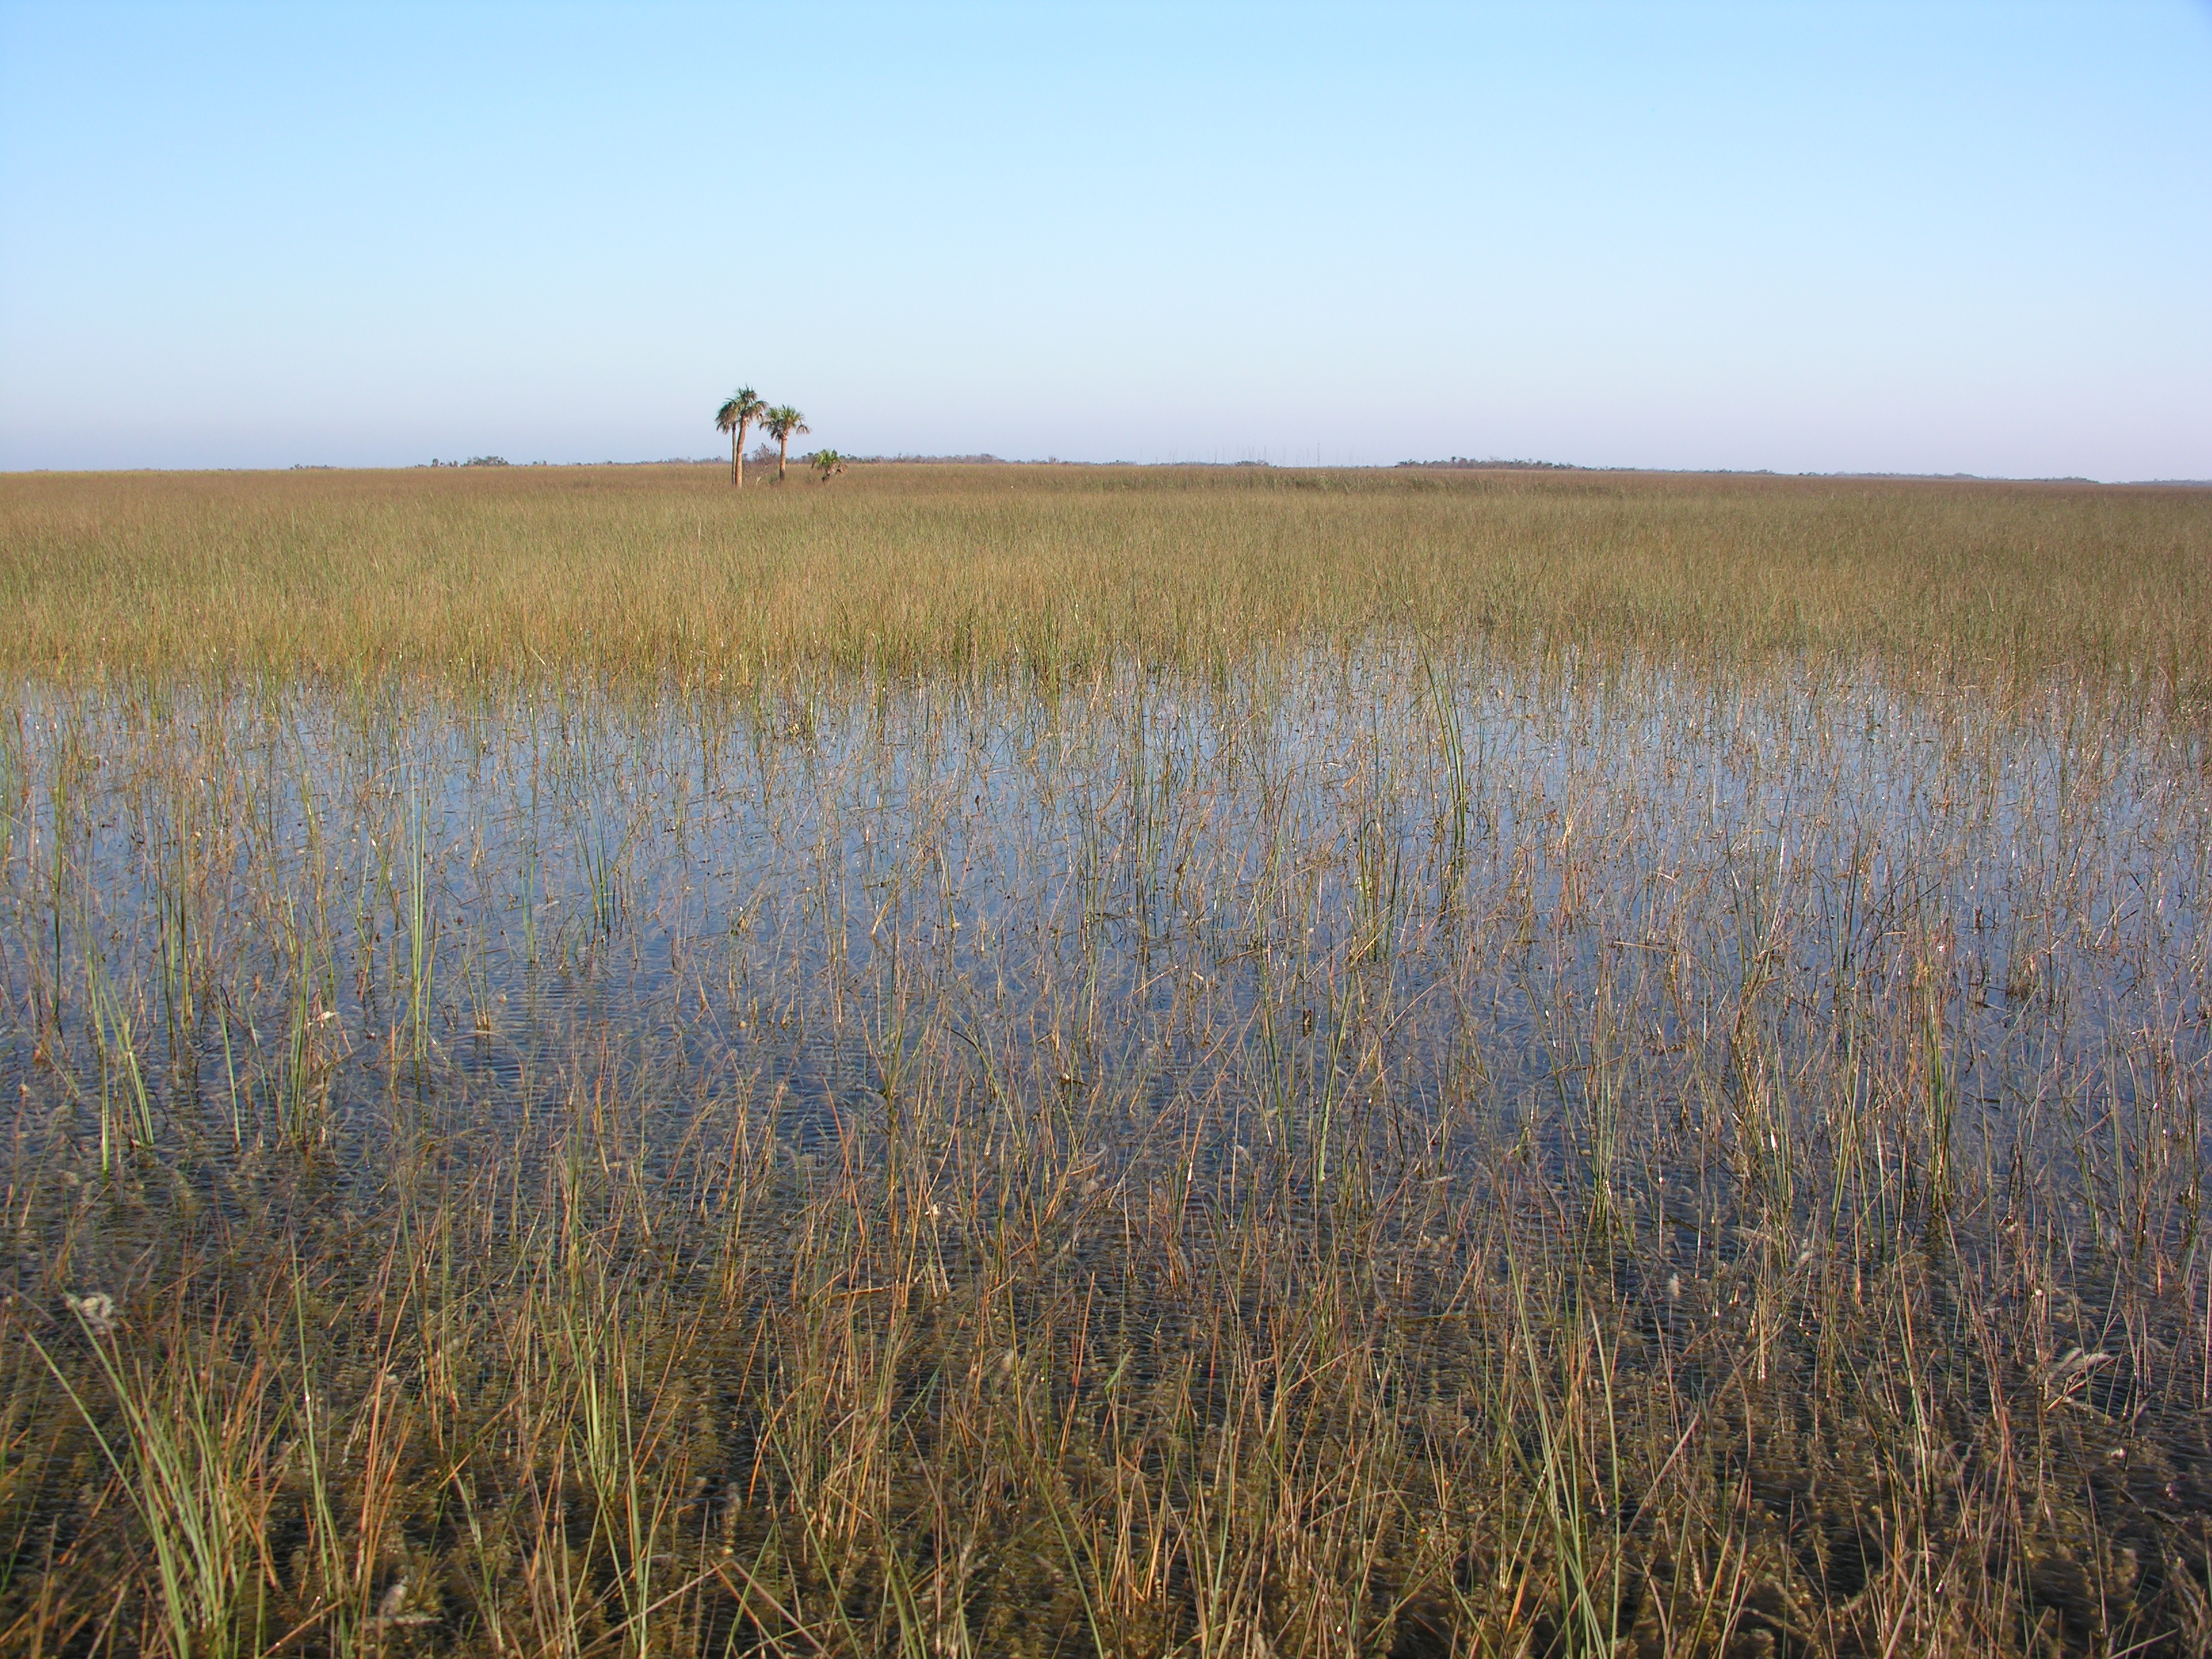
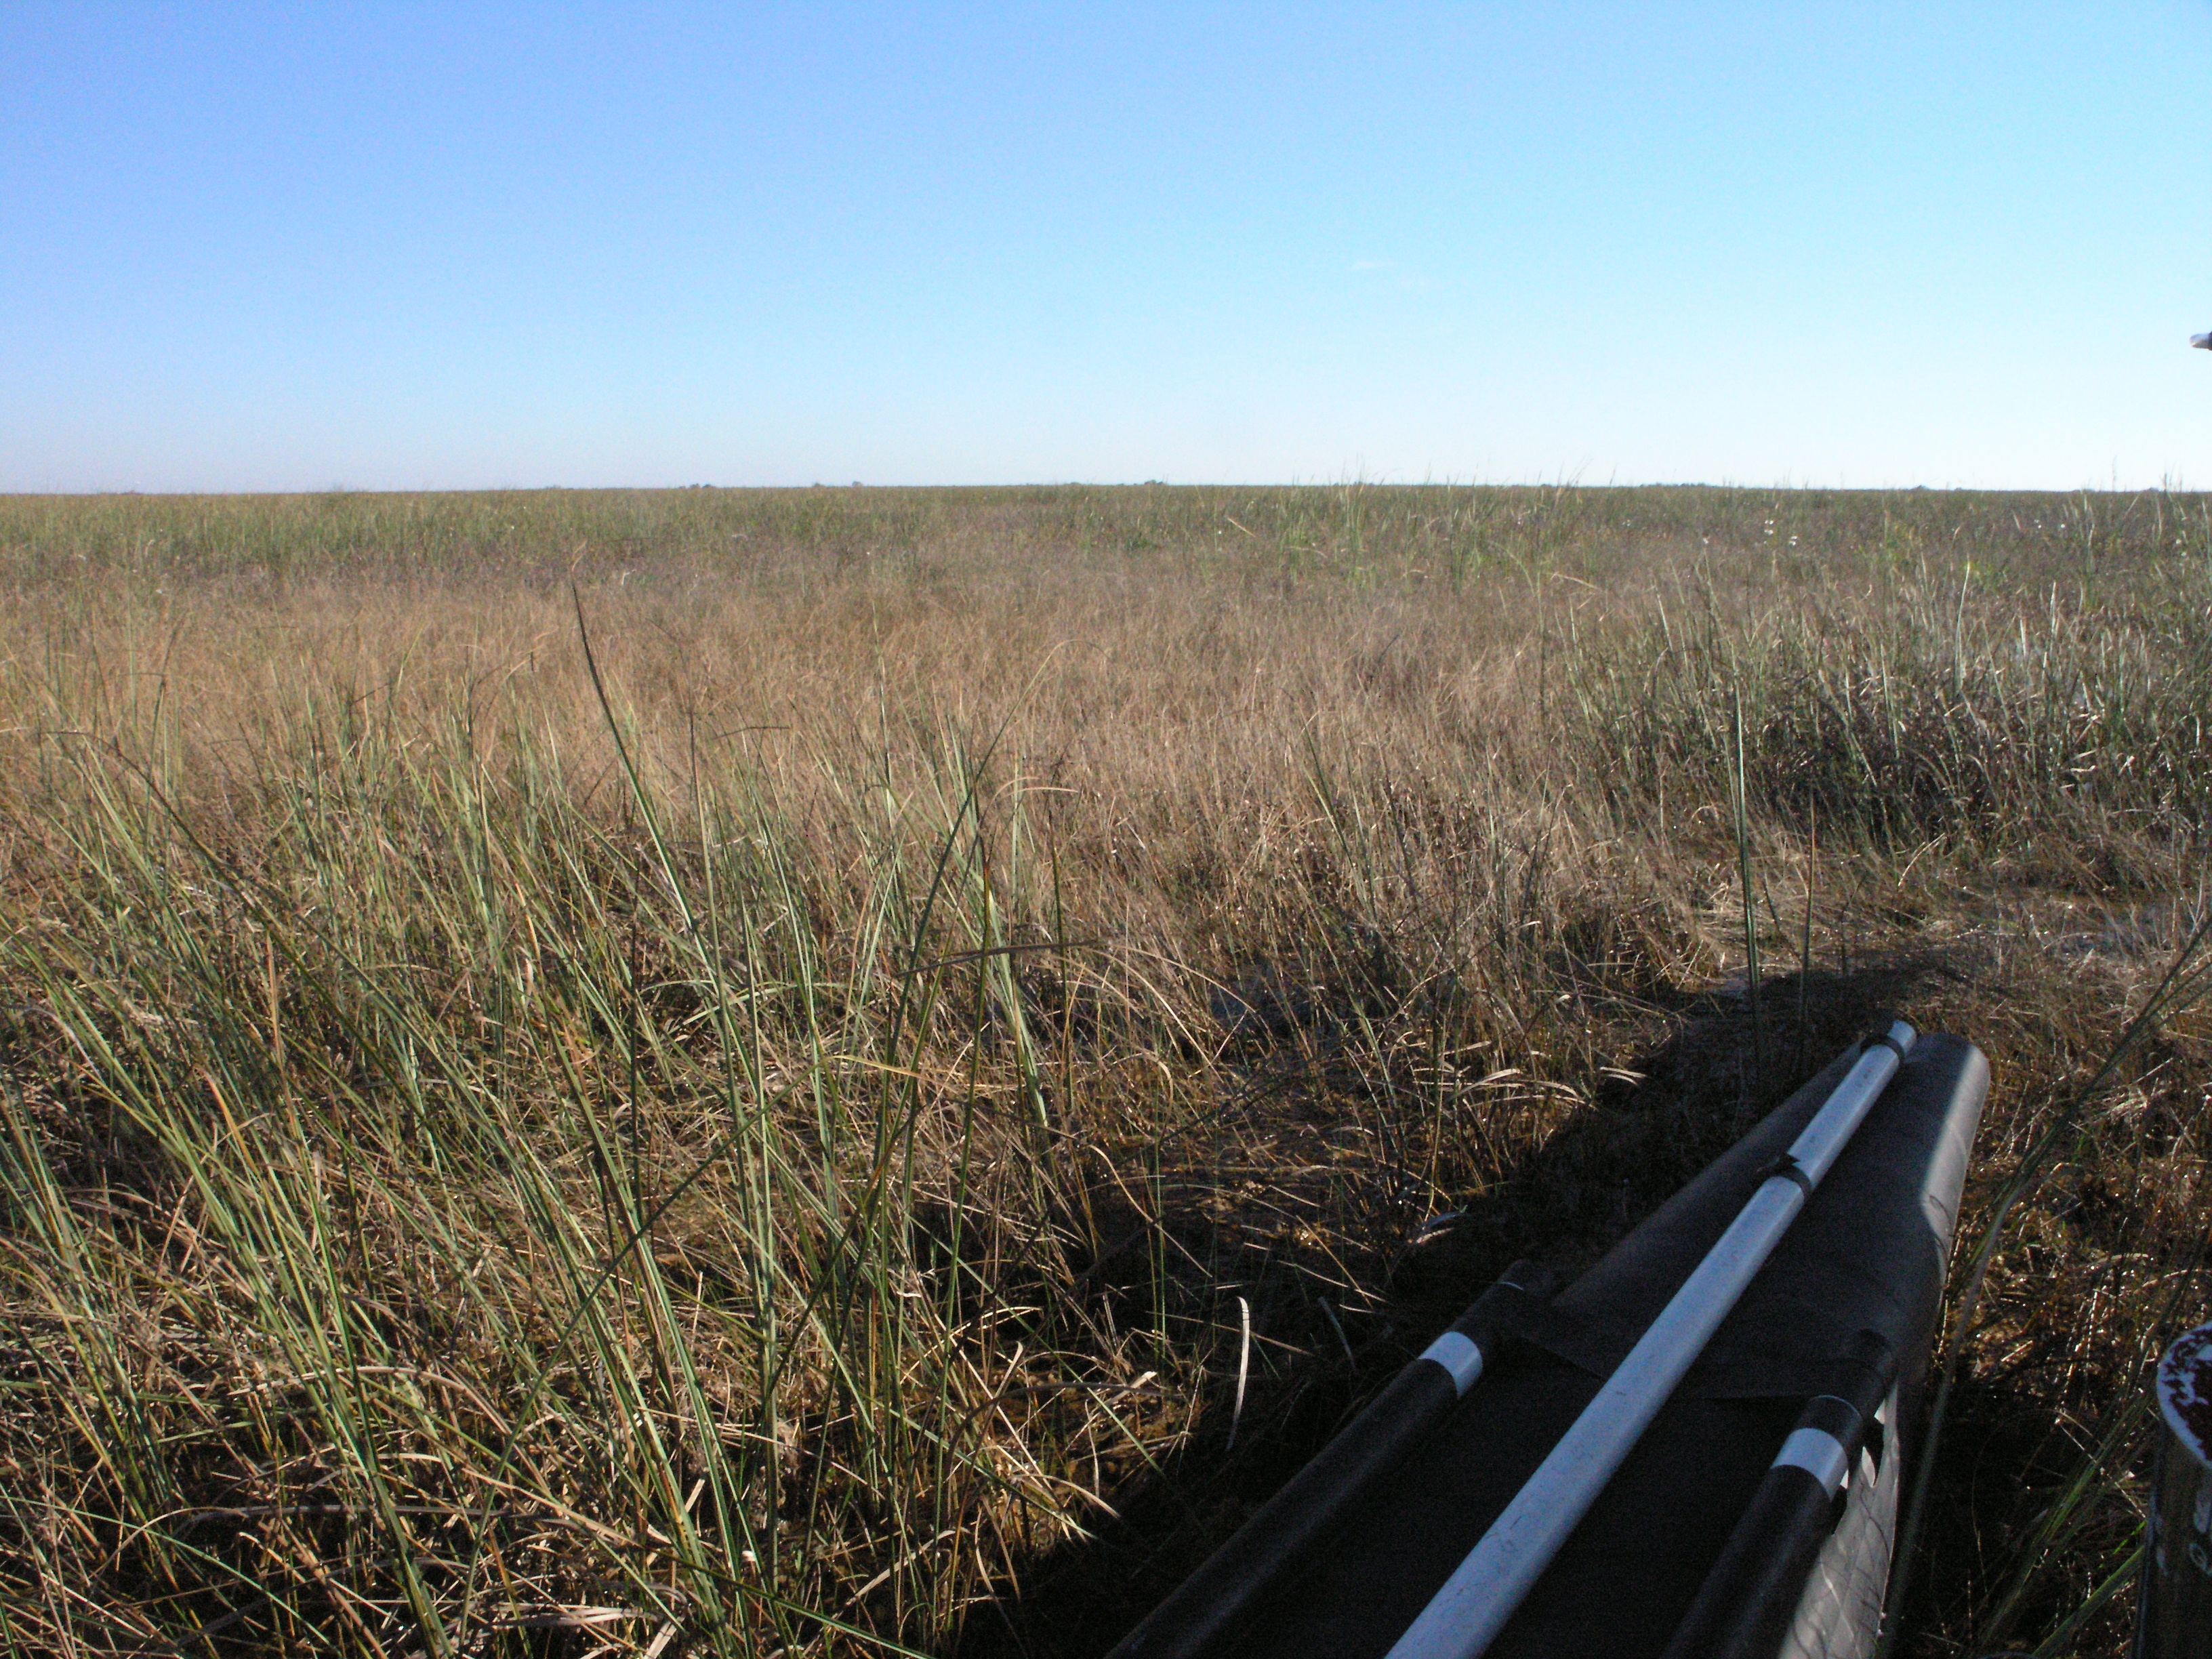
Right Panorama
Transects
The number in each plant column records the number of quarter-meter-squared quadrats in 5 (1-meter-squared) quadrats in which that species was found at any given site.The 5 (1-meter-squared) quadrats were distributed to the right and left every 2 m along the 10 m transect.If the plant was not present, the cell has a 0;if the plant was present in every quarter-meter-squared quadrat, the number in the cell is 20.
| Item | Transect 1 | Transect 2 | Family | Scientific Name | Common Name |
|---|---|---|---|---|---|
| JustAngu | 0 | 17 | Acanthaceae | Justicia angusta | Narrow-leaved waterwillow |
| SagiLanc | 0 | 2 | Alismataceae | Sagittaria lancifolia | Bulltongue arrowhead, Lanceleaf arrowhead |
| CrinAmer | 3 | 0 | Amaryllidaceae | Crinum americanum | Swamp-lily, Seven-sisters, String-lily |
| PeltVirg | 0 | 3 | Araceae | Peltandra virginica | Green arum, Green arrow arum |
| CladJama | 20 | 0 | Cyperaceae | Cladium jamaicense | Saw-grass, Jamaica swamp sawgrass |
| EleoCell | 14 | 4 | Cyperaceae | Eleocharis cellulosa | Gulf Coast spikerush |
| RhynMicr | 0 | 1 | Cyperaceae | Rhynchospora microcarpa | Southern beaksedge |
| RhynSpp | 1 | 6 | Cyperaceae | Rhynchospora sp. | |
| RhynTrac | 0 | 17 | Cyperaceae | Rhynchospora tracyi | Tracy's beaksedge |
| UtriFoli | 1 | 10 | Lentibulariaceae | Utricularia foliosa | Leafy bladderwort |
| UtriGibb | 18 | 19 | Lentibulariaceae | Utricularia gibba | Cone-spur bladderwort, Humped bladderwort |
| UtriPurp | 9 | 8 | Lentibulariaceae | Utricularia purpurea | Eastern purple bladderwort |
| PontCord | 0 | 6 | Pontederiaceae | Pontederia cordata | Pickerelweed |
| TyphDomi | 0 | 4 | Typhaceae | Typha domingensis | Southern cat-tail |
| BacoCaro | 6 | 7 | Veronicaceae | Bacopa caroliniana | Lemon hyssop, Lemon bacopa, Blue waterhyssop |
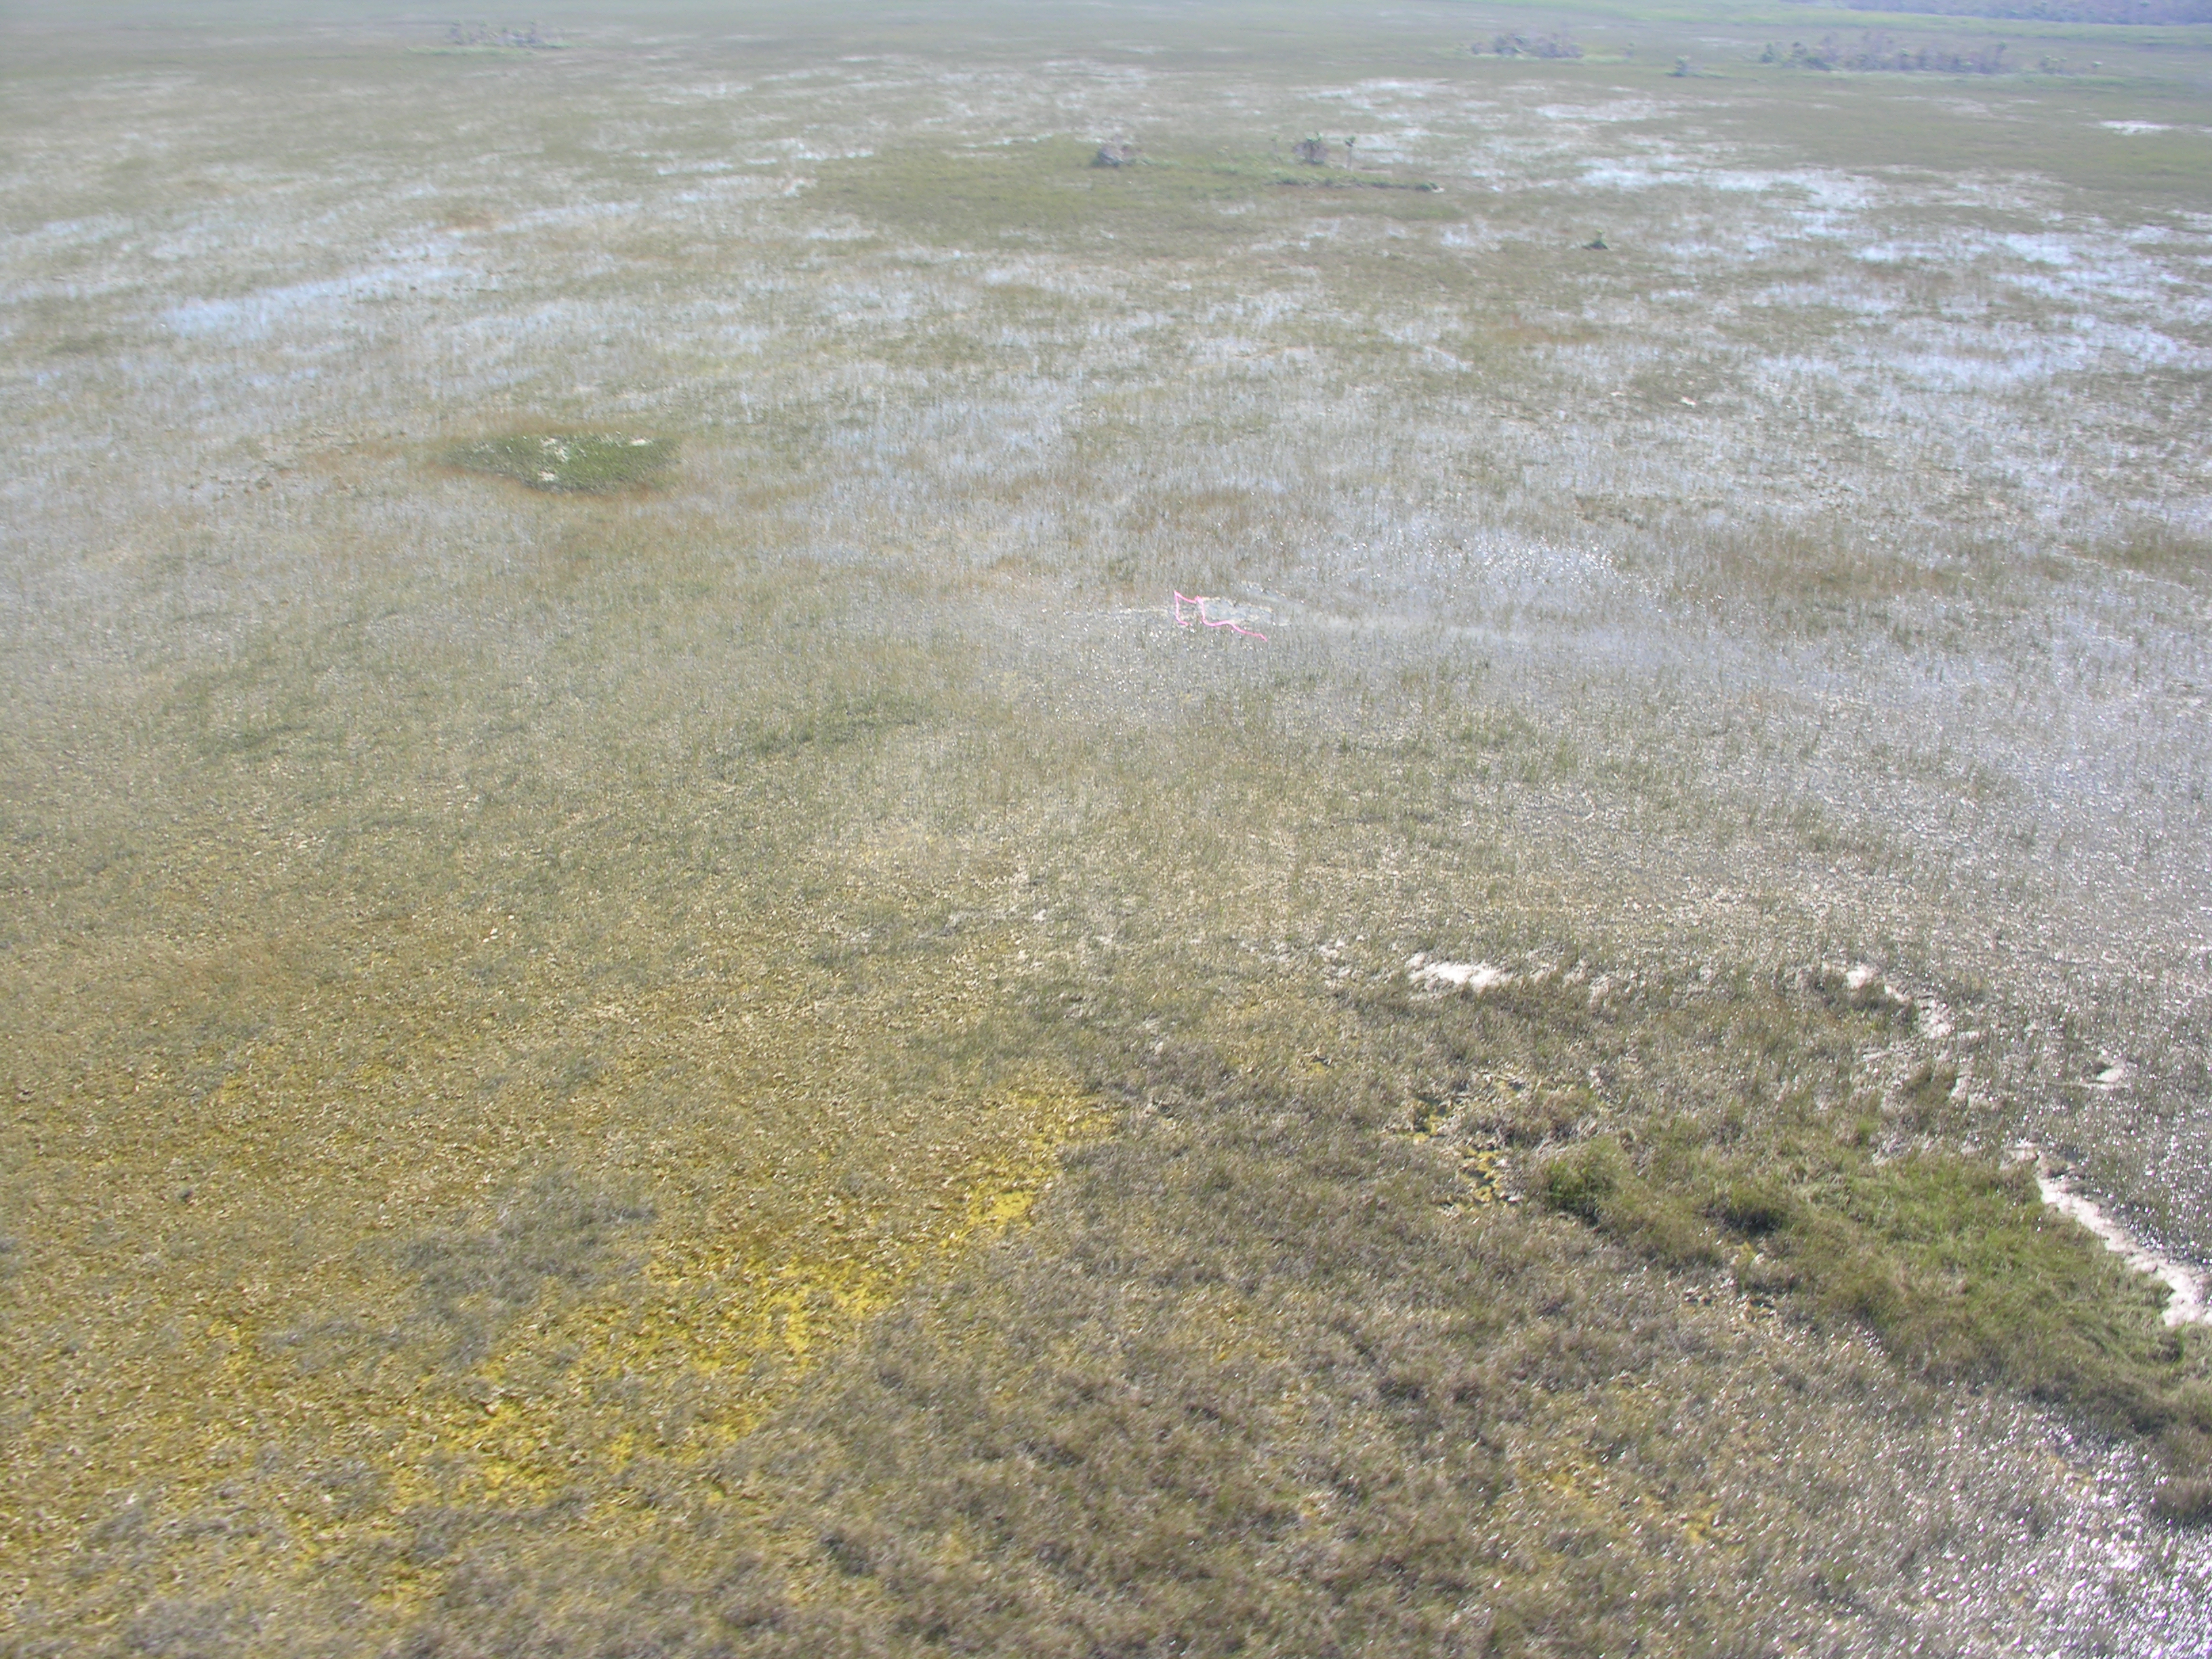
Exotics
In the 2005 R-EMAP sampling invasive exotic plant species were surveyed in two ways. The first survey was done on the helicopter fly-in to the GPS site and covered the general area of the site, while the second was a 360° site survey from the helicopter pontoons after landing and covered the immediate area of the site. In the aerial (A) helicopter survey we looked for the presence of six invasive exotic species (Casuarina spp., Lygodium microphyllum, Melaleuca quinquenervia, Neyraudia reynaudiana, Pennisetum purpureum and Schinus terebinthefolius), as well as the presence of cattail (Typha domingensis). In the survey from the helicopter floats (F) we recorded the presence of any exotic seen; the only additional exotic species observed from the floats was Salvinia minima. In both surveys we recorded the presence of species and quantified their abundance using categories for the number of individuals. The categories used were 0 (i.e., not present), 1 individual, 2 - 10 individuals, and > 10. We did not find Neyraudia reynaudiana at any site, so this species was not included in the database.
| Item | Abundance | Scientific Name | Source |
|---|---|---|---|
| CasuSp_A | 0 | Casuarina species | aerial fly-in |
| CasuSp_F | 0 | Casuarina species | floats |
| LygoMicr_A | 0 | Lygodium microphyllum | aerial fly-in |
| LygoMicr_F | 0 | Lygodium microphyllum | floats |
| MelaQuin_A | 0 | Melaleuca quinquenervia | aerial fly-in |
| MelaQuin_F | 0 | Melaleuca quinquenervia | floats |
| PennPurp_A | 0 | Pennisetum purpureum | aerial fly-in |
| PennPurp_F | 0 | Pennisetum purpureum | floats |
| SalvMini_F | 0 | Salvinia minima | floats |
| SchiTere_A | 0 | Schinus terebinthefolius | aerial fly-in |
| TyphDomi_A | > 10 | Typha domingensis | aerial fly-in |
| TyphDomi_F | > 10 | Typha domingensis | floats |
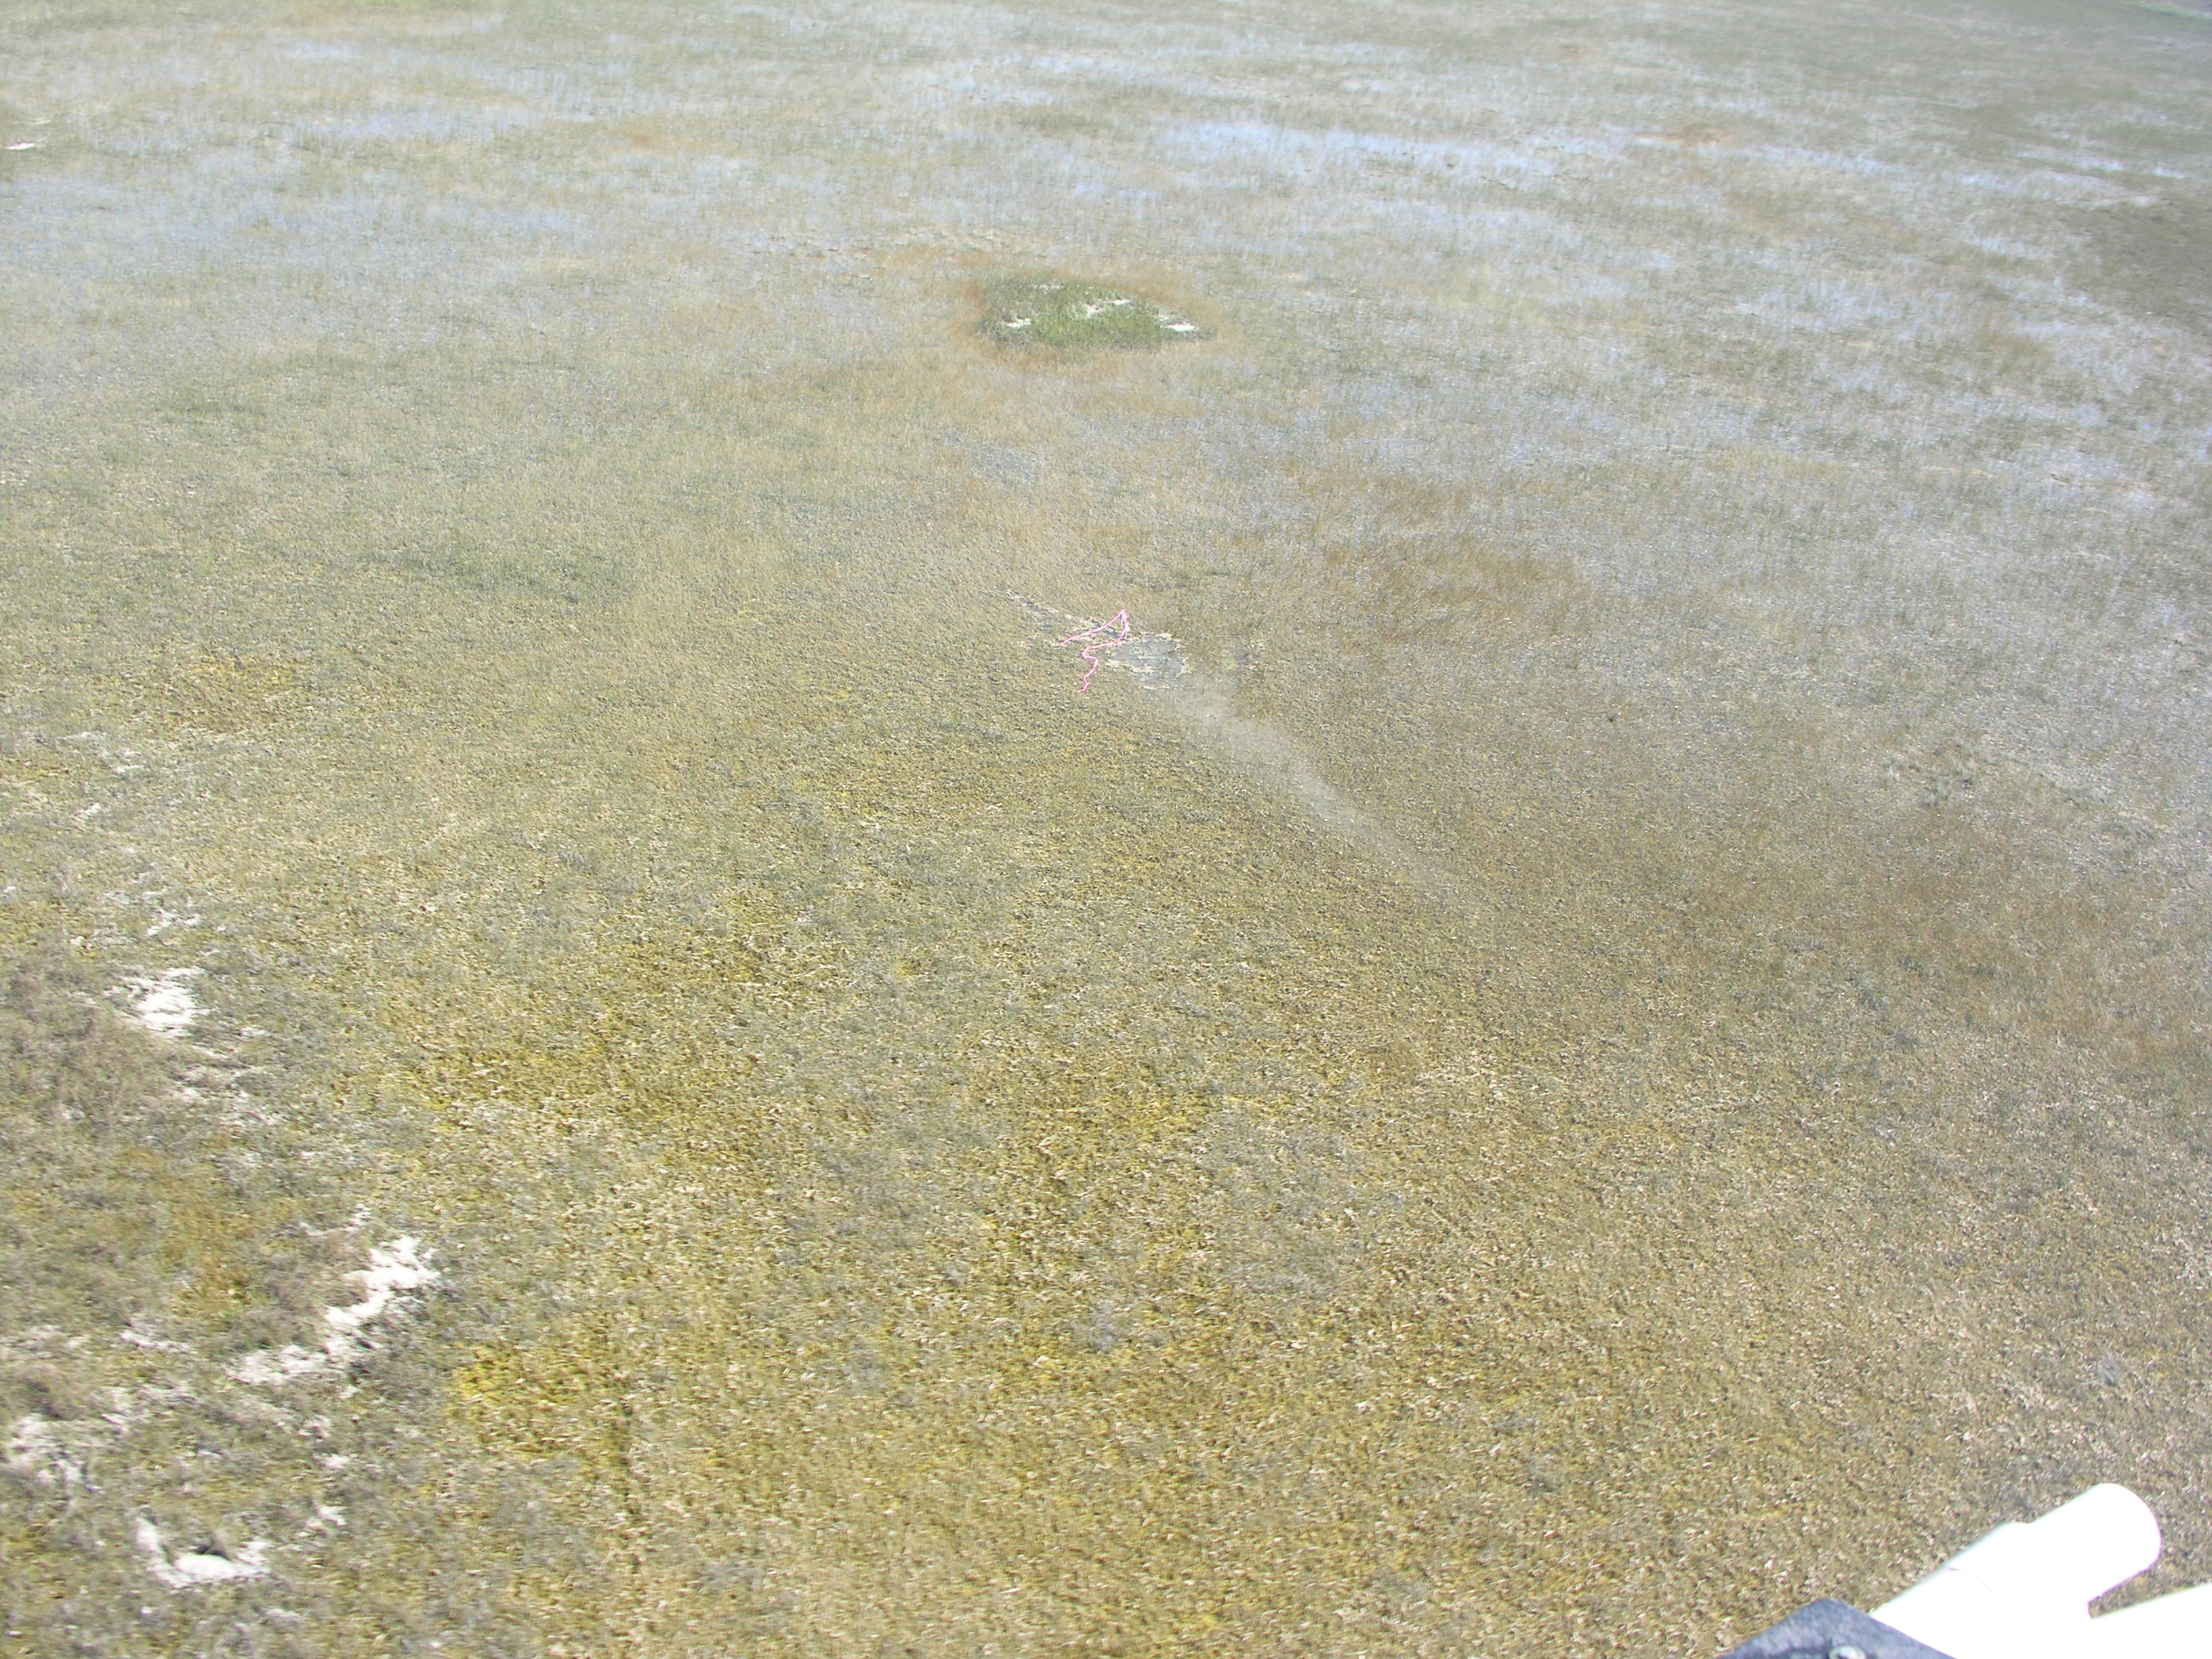
Vegetation Map
Aquatic
As part of the EPA‘s R-EMAP Phase III wet season sampling, 54 sites (designated by Olsen numbers/station numbers) spanning the Greater Everglades were sampled for aquatic fauna in November and December 2005. Densities of small fish and large macroinvertebrates were quanitifed using a standardized throw-trap methodology, and macroinvertebrate infauna were enumerated from periphyton cores and floc samples. Community compositions and wet weights were recorded for throw-trap samples, and fish and crayfish lengths were measured. Counts and community compositions were recorded for infauna and scaled according to substrate samples (g AFDM and/or mL of periphyton or floc). Finally, stable isotope analysis was conducted on a subset of the fauna. These data were then used to address questions about consumer densities, community structure, and food webs along hydrological (disturbance) and productivity gradients.
Three throw-traps replicates were deployed per station.
| Type | Item | Throwtrap 1 | Throwtrap 2 | Throwtrap 3 | Units | Scientific Name | Common Name | Note |
|---|---|---|---|---|---|---|---|---|
| PeriCover | 3 | 5 | 2 | % | percent of trap area covered by periphyton | |||
| PeriVolume | 400 | 1300 | 0 | ml | biovolume of periphyton and submerged plants | |||
| PlantCover | 5 | 5 | 10 | % | percent of water surface covered by vegetation | |||
| PlantHt | 43 | 46 | 53 | cm | plant height from water surface | |||
| WaterDepth | 40 | 39 | 46 | cm | ||||
| Fish | 0TotalFish | 5 | 8 | 1 | ||||
| Fish | funchr | 2 | 0 | 1 | Fundulus chrysotus | Golden topminnow | ||
| Fish | gamhol | 2 | 5 | 0 | Gambusia holbrooki | Mosquitofish | ||
| Fish | hetfor | 1 | 2 | 0 | Heterandria formosa | Least killifish | ||
| Fish | lepmar | 0 | 1 | 0 | Lepomis marginatus | Dollar sunfish | ||
| Invertebrates | 0TotalInv | 5 | 28 | 17 | ||||
| Inverterbates | belspp | 0 | 0 | 1 | Belostoma spp. | Giant water bug | ||
| Inverterbates | celepo | 0 | 3 | 1 | Celithemis eponina | Dragonfly larva | ||
| Inverterbates | coenag | 1 | 0 | 3 | family Coenagrionidae | Damselfly larvae | ||
| Inverterbates | palpal | 4 | 23 | 12 | Palaemonetes paludosus | Grass shrimp | ||
| Inverterbates | profalF | 0 | 1 | 0 | Procambarus fallax F | Crayfish (female) | ||
| Inverterbates | profalM | 0 | 1 | 0 | Procambarus fallax M | Crayfish (male) | ||
| Vegetation | baccar | 0 | 0 | 2 | percent of floating mat volume | Bacopa caroliniana | water hyssop | |
| Vegetation | clajam | 46 | 12 | 159 | stem counts | Cladium jamaicense | saw-grass | |
| Vegetation | elecel | 0 | 48 | 0 | stem counts | Eleocharis cellulosa | Spikerush | |
| Vegetation | jusova | 2 | 12 | 2 | stem counts | Justicia ovata | water willow | |
| Vegetation | utrifol | 0 | 1 | 0 | percent of floating mat volume | Utricularia foliosa | bright green bladderwort |